Introduction
In my most recent post on November 18th, about updating my Coronavirus model to handle the impact of vaccines, I gave some examples of how case numbers, and more specifically death rates might be improved for the UK through a vaccination programme.
Now that there seem to be several vaccines imminent, with efficacies ranging from 70% (Oxford/AstraZeneca) through 90% (Oxford/AZ via a different inoculation regime, and Pfizer/BioNTech), to 95% (Moderna) and several others in the mix, I explore some sensitivities in more detail, and also apply the model to the USA. Here is a summary of some of the main options.

Any models of vaccination scenarios rely on some assumptions about the pace of roll-out and efficacy of the vaccine(s), but the advantage of having a (bottom-up) mechanistic model is that I can adapt the scenarios immediately to what we learn about when and how a vaccine might be distributed.
What was already clear last time was that if a vaccine had been available at the outset, hundreds of thousands of lives world-wide might have been saved; at this stage, the potential is less, of course, but it remains, as always, that the earliest possible and decisive action is best in a disease growth situation.
I have also provided a link to the “Ask the Experts”: YouTube video from today, November 25th, about vaccines in the Covid-19 context. It is must-watch video for anyone interested in Covid-19 vaccination (all of us?) with Prof Tim Spector, professor of genetic epidemiology at King’s College London and the Zoe project, and Prof Peter Openshaw of Imperial College, hosted by Christina Hu of the Zoe Covid Symptom Study.
Vaccine options and the UK outlook
It has been reported that the UK Government has purchased sufficient vaccines, ahead of their approval and issue, to serve the needs of the whole UK population, assuming each requires two inoculations.
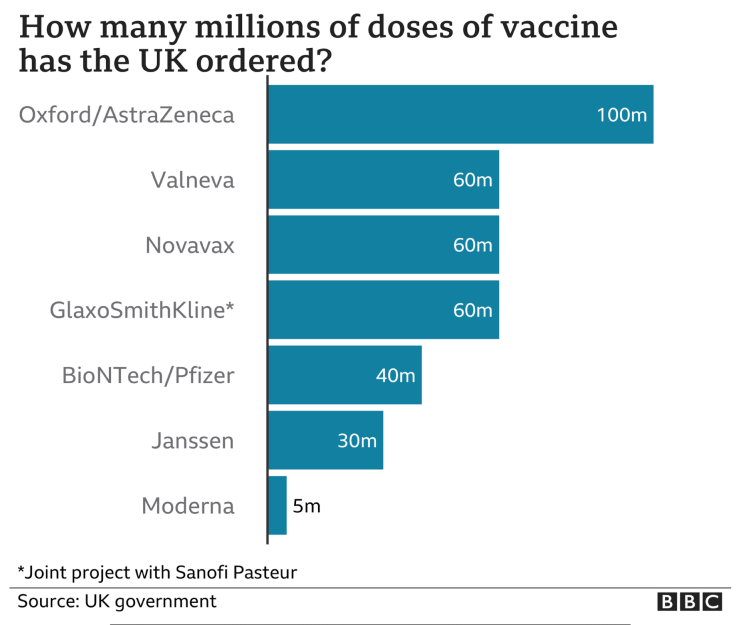
Three of the main options have different costs and other characteristics which will influence their approval and take-up by Governments. The Oxford/AZ vaccine is currently less than 10% of the cost of the other two listed, although this is likely to change. Low temperature storage requirements of the Pfizer option tend to militate against storage at small local distribution points.

UK modelling
One assumes that immunity lasts long enough so that the exercise can be repeated, if necessary, when more becomes available later in 2021. It isn’t clear yet what the duration of any conferred immunity might be, but it seems that it might be less than a year. In such a case, maybe continuing SARS-Cov-2 vaccination could take place alongside the annual flu vaccine.
The assumption in my model is that vaccination would be continual (i.e. repeated as necessary to achieve the stated efficacy, for anyone receiving it, into the future).
I have run many model cases for different efficacies – 70%, 90% and 95% – assuming, at this point, three points at which capacity significantly increases, starting at 100,000 people per day, through 200,000 and then to 300,000 over the course of a few months. I have chosen 1st January, 1st February and 17th March 2021 as three dates that might see these rates achieved, for modelling purposes, but as soon as I learn more about what the expectations are, I will update the dates and the rates per day in the model .
500,000 per day would seem to be a working average for the UK Government target, once the programme is in full flow, assuming the Government’s announcement of about 1500 centres, working at between 200 and 500 inoculations per day. Setting 350 as the average inoculations per day per centre gives 1500 x 350 per day, or 525,000 – 1/2 million per day, in round numbers, say. Once I see how long it might take to ramp up to that, I can run the projections again.
Base case for no vaccinations
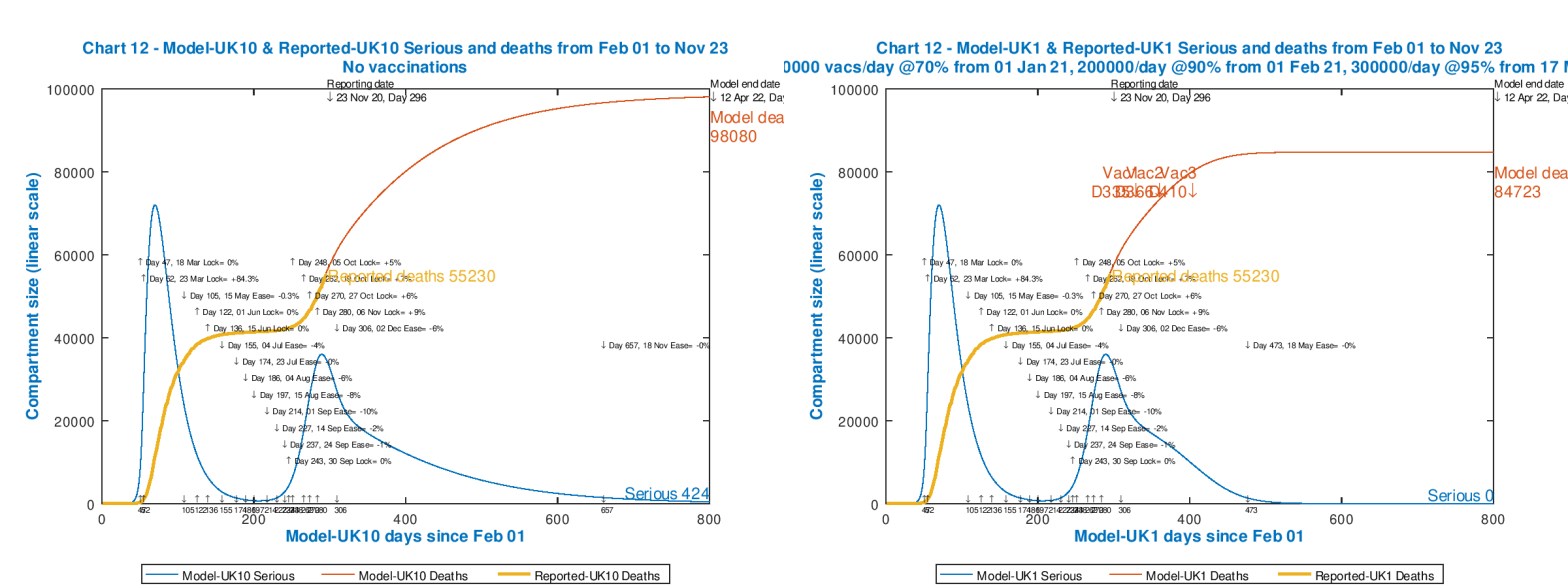
The first model run is to set the base case, as I did before in my most recent post on November 18th, which I show below. The orange, thicker curve shows the reported deaths to date (23rd November in this case). The red curve (fitting the reported curve very well to date) shows the modelled deaths out to 800 days (April 12th, 2022), and the blue curve represents “Seriously Sick” people in my 8-compartment model (originally authored by Prof Alex de Visscher) which classifies Uninfected, Vaccinated, Incubating, Sick, Seriously Sick, Better, Recovered and Deceased individuals. We can clearly see the two peaks in Seriously Sick people, matched by the impact on the Cumulative deaths.
Alex’s original 7-compartment model code and description is available in his 22nd March 2021 research publication, and we have made several updates since then, including the vaccination addition I have just made, to extend it to 8 compartments, described in my most recent blog post. Errors and omissions all mine!
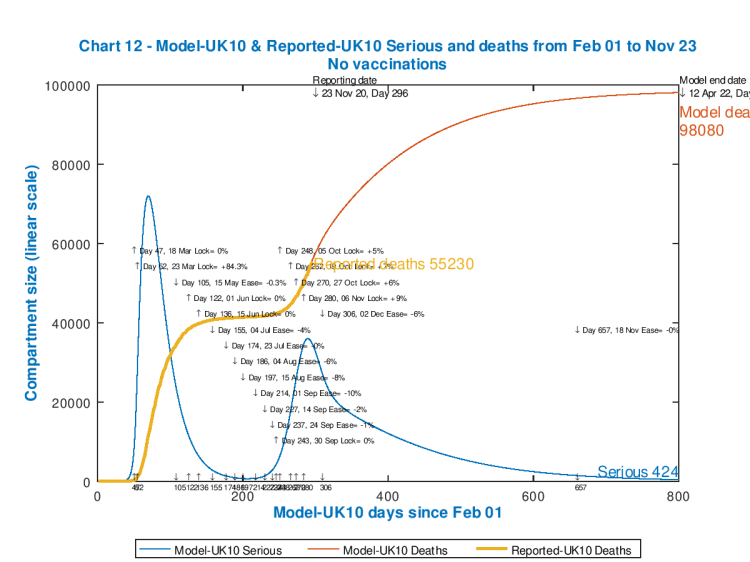
This chart is identical, apart from the updated reported numbers of deaths, to the one I showed in my November 18th post. It represents the UK case for no vaccinations.
In the body of the chart, I show the various interventions made from time to time, broadly matching the various measures taken by UK Government (and the home nations), and I have already assumed a partial easing of the current “lockdown” on December 2nd, but back to a higher level than before the current set of measures started. We have yet to see reliable detail of any festive season arrangements.
First-cut vaccine projection
Next, just to set a simple comparison, I show what might be the best we can expect in the short term; the case for the application of a vaccine at a steady inoculation rate of 300,000 per day from the 1st January, at 95% efficacy.
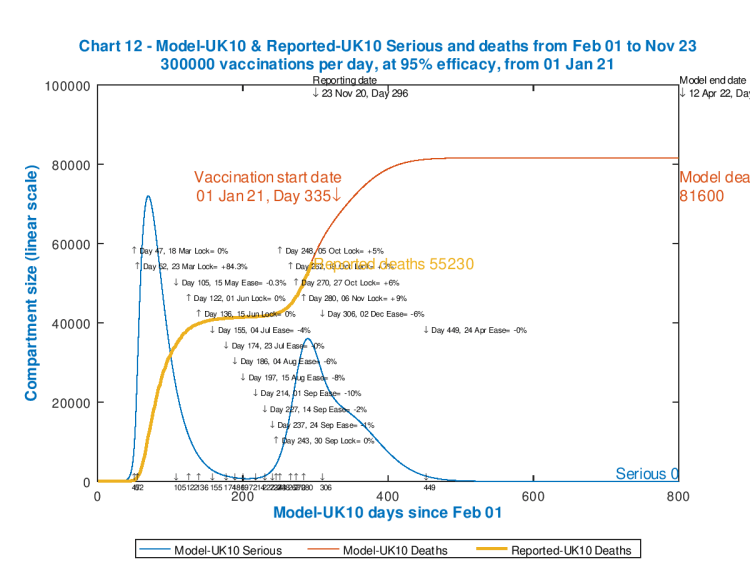
Is is possible that vaccination could start during December, making this a possibly conservative estimate; on the other hand, 95% efficacy is quite high, and 300,000 per day might be quite a stretch to begin with (judging by how long test & trace took to ramp up). So I present this as, possibly, the most optimistic short-term delivery projection. Deaths have been reduced to 81,600 by Day 800 (12th April 2022). Model deaths plateau well before this, so I also show here the outlook to 450 days (April 27th 2021).
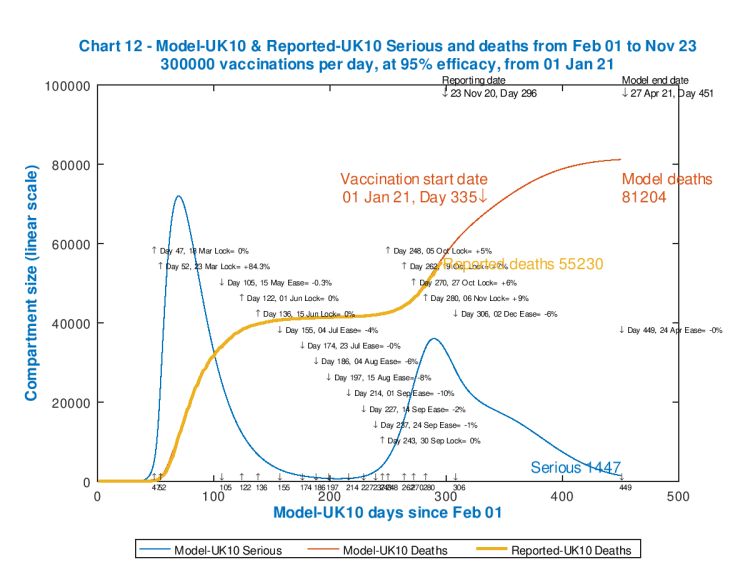
We see that nearly all of the lives saved occur within the 85 days or so until April 27th 2021 in this model case, with 81,204 deaths; but this should be compared with the “no-vaccinations” scenario to that date, which I show below.

We see that by that date, 27th April 2021, modelled deaths would reduce from 86,315 to 81,204, saving over 5,000 lives. They were still rising fast in the unvaccinated model above, and so the faster we can mobilise the vaccine the better, of course.
I will add here, for completeness, the University of Washington UK forecast to March 1st 2021 (which would be Day 394 in my model), with data drawn from current data at the Worldometers UK web page, showing the following projection for March 1st 2021:
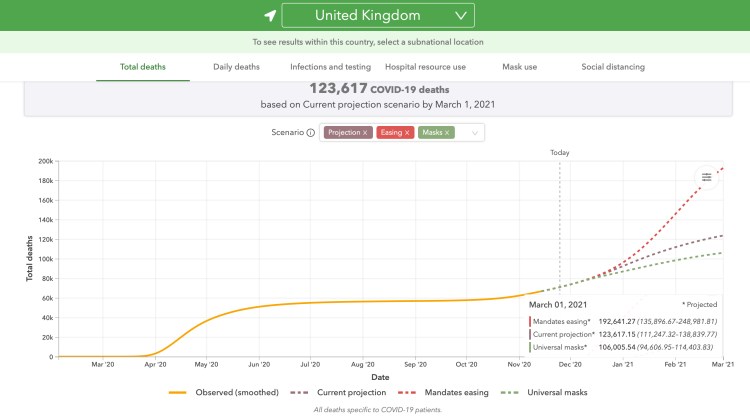
This is more pessimistic than my model forecast, but in my model assumptions I have included allowance (+9%) for the intervention measures taken this month of November in the UK’s home countries, as well as less than a full withdrawal (-6%) of those interventions when they come to an end on December 2nd. My model’s intervention status would probably be greater than that for the University of Washington model outlook.
Discussion – is it realistic to expect vaccine delivery soon?
As I said last time, the model shows that a vaccine available at the outset of the epidemic would have kept UK deaths below 20,000 at the present time. The cumulative impact of the pandemic in the UK and worldwide through 2020, without a vaccine, has been tragic.
The current outlook, however, has to be relative to where we are now; miracles have been worked to have so many vaccine options currently at the point of being submitted for approval. Where was time saved by pharmaceutical companies modifying the process to deliver a vaccine so quickly?
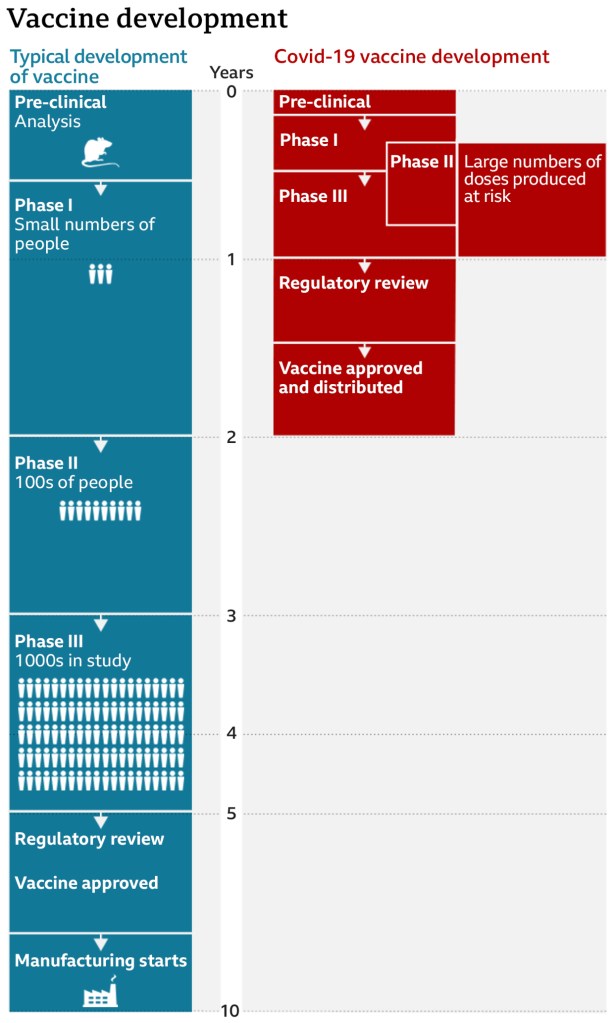
There has been some overlap in the stages of trials of the SARS-Cov-2 vaccines, and also the manufacturing process has started early, at the financial risk of the organisations involved.
This might have been partly a result of the competition among developers to be first to market. It reminds me of a lesson learned from the Manhattan Project, the wartime development project in the USA for the Atomic Bomb, which had several independent strands of development, both in terms of research and bomb design, to help assure that at least one of the projects would succeed.
With approvals now applied for, it seems likely that at least one vaccine will be available by the turn of the year.
The importance of vaccine availability
I don’t buy the excess deaths arguments that have been deployed to persuade us that Covid-19 isn’t a lot worse than the seasonal flu deaths we might have expected, and that natural herd-immunity could be built up by allowing the younger population to work and socialise, with greater chance of being infected, while segregating (euphemistically called “protecting” or “shielding”) the old. I have presented expert opinion (of others) in previous posts on these topics, for example concerning age-dependency on September 22nd, partly by reference to Adam Kucharski’s work.
I have covered herd immunity several times, including in my blog post on October 21st, with a reference to Prof. Graham Medley who published a short narrative piece in The Lancet on this topic, where he said:
“The epidemic is ongoing, and it remains the case that although most people remain susceptible to infection, control of transmission has to be through non-pharmaceutical interventions. Isolation and quarantine, physical distancing, and contact tracing will be required until transmission is reduced by immunity. Ideally, this immunity will be vaccine induced rather than through transmission of the disease.”
“There have been increasing suggestions that one option is to simply protect everyone who is at risk of infection and allow the epidemic to spread in those at low risk…I noted that this approach is conceptually appealing but impossible in practice. It is not a strategy I endorse.“
For other diseases, our successes in the past in controlling or eradicating them has been through vaccination, not by allowing infections to run through the community.
The excess deaths measure might mitigate the specific issue of classification of deaths as “Covid” or “non-Covid”; but, with the interventions regarding social distancing, quarantine, shielding and others, it is clear that even if deaths had reduced to the same level as the 5-year average (i.e. zero excess deaths, which for many countries they are not), Covid deaths will have replaced fewer other deaths (eg industrial accidents, travel accidents and others).
That excess deaths measure, however, substitutes arguments about allocating cause of death (Covid or not) with arguments about the relative mix and causation of all deaths. We are likely to see more deaths as a result of isolation, for example, through reduced early diagnosis of other “dread” diseases, or through higher levels of mental illness, both now and later. We also see the significant issues with enduring illness, in some cases, from “long-Covid”. Deaths are not the only measure of suffering.
So I deprecate attempts to pass Covid-19 off as slightly worse flu, with some proponents’ concomitant advice others to ignore, and their own failure to take even basic precautions such as mask-wearing.
No doubt, now that vaccines are to be released, there will be more nonsense peddled, morphing to anti-vaxxer arguments from some of the same people, and more.
I might add that if, as I have reported before, the arrest of the Covid-19 epidemic requires 70% of the population to be vaccinated, as suggested by Dr Anthony Fauci in the USA, that I first reported in my June 28th blog post, and have explained in several blog posts since, in different contexts, there are two corollaries to this statement:
a) If the vaccine were less than 100% effective, then that 70% would have to be increased by the same proportion, as I showed in my most recent blog post on November 18th, and in the associated mathematical derivation in my Google document; and
b) more obviously, if only 70% of the population accept vaccination, then the vaccine would have to be 100% effective to achieve the 70% coverage required. If anti-vaxxers are more influential than that (although as reported here, the NHS, of course, is well aware) and less than 70% of the population subscribe, then we can’t reach the target of 70% even with a 100% effective vaccine. Andrew Wakefield and his ilk have a lot to answer for.
Having presented this case for a vaccine approach, and its availability, I’ll now explore the UK outcomes a little more closely, and also apply the modelling methods to the USA.
Sequential build-up of vaccination capacity
There are many variations I could run, but maybe a somewhat realistic combined one is where we start with lower efficacy and inoculation capacity, (70% and 100,000/day respectively on January 1st 2021), and then a month later to 90% and 200,000/day, and finally, on March 17th, to 95% and 300,000/day delivery, extending into the future, using otherwise the same data on NPIs (Non Pharmaceutical Interventions) as above for comparison, which shows the flexibility of the model. Within a couple of weeks I would hope to have more reliable estimates of what vaccine can be delivered, how fast and with what efficacy. These rates (and, I hope, the lower efficacies) are likely to increase as time goes on.
Here is the 450 day projection for this vaccination schedule.
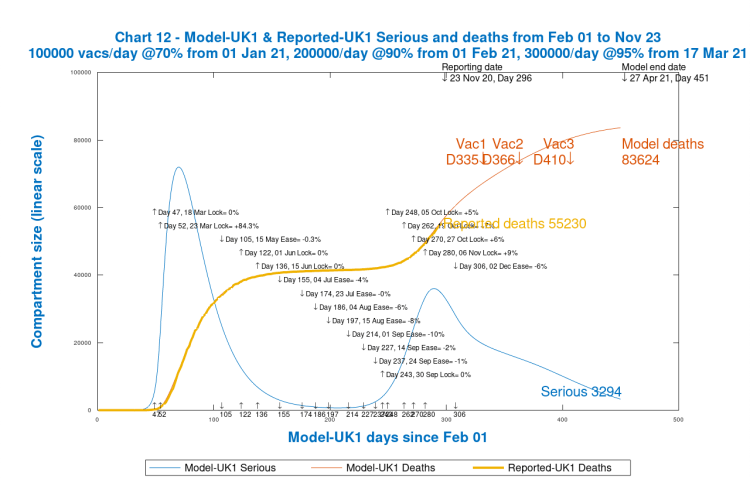
In this case we see that there are more deaths than in the previous case, owing to the ramped-up (rather than immediately high) modelled efficacy and delivery capacity. I would guess that the outcome would be somewhere between these two cases. As far as the long-term 800-day outlook is concerned, see it here.

We see more deaths at 800 days, 84,723 instead of 81,600 for the “best” case with starting 300,000 capacity at 95% efficacy. There are around 3,000 more modelled deaths, but still a lot less than the 800-day no-vaccination scenario, 98,080, representing around 13,000 saved lives. But for any longer term forecasts such as this, we must remember that other actions would no doubt be taken (one would hope) to control the pandemic through further NPIs (Non Pharmaceutical Interventions).
I would also say that some (including Prof Tim Spector, in the video I mentioned) are forecasting the possibility of a “third wave” of infections as the winter months take their toll. The somewhat unforecasted autumn increases in cases, hospital admissions and deaths show the danger of the SARS-Cov-2 virus re-establishing itself if the interventions we are making are relaxed too much, especially over the family festive season, while the vaccine(s) take time to establish their full effect.
That vaccine effect is very dependent on efficacy and rate of inoculation, as we can see from the model outputs. We have yet to see what efficacy and rates can be achieved.
The USA
I presented no US vaccination-based projections last time, because I didn’t (and still don’t) have any direct evidence about what the inoculation capacity might be. But I will, this time, briefly present a few charts, based on inoculation capacities at about the same ratio to the USA’s population as compared with the UK.
Our UK population is about 67 million, and the USA is about 330 million, so the ratio of about 5 applied to the vaccination capacities I use for the UK – 100,000, 200,000 and 300,000 – would correspond to about 500,000, 1,000,000 and 1,500,000 vaccinations per day for the USA.
I will continue to use the 70%, 90% and 95% efficacies for the three stages (although I would guess that the mix of vaccines to be used in the USA might be differently sourced) and the same dates for each – January 1st, February 1st and March 17th respectively.
It is true to say that, as far as civil matters are concerned, although the USA President is Commander-in-Chief of the armed services, much locally is in the hands of State Governors. This isn’t to say that more can’t be done, and as I said in my recent post on November 10th, so much more could and should have been done by US leadership in messaging and example, as well as by those measures that a President could take, for example through federal funding to support more local actions.
(Even here in the UK, some local authorities had resisted the higher Tier levels of measures until agreed funding was in place, and will probably do so again as we move through December with new arrangements.)
The growth in daily case and death rates has continued even faster in the USA since that November 18th blog post, and so I have adjusted my model to fit reported numbers to date. My base forecast also assumes some immediate intervention adjustments on Inauguration Day, January 20th (day 354 of my model) as Joe Biden takes office.
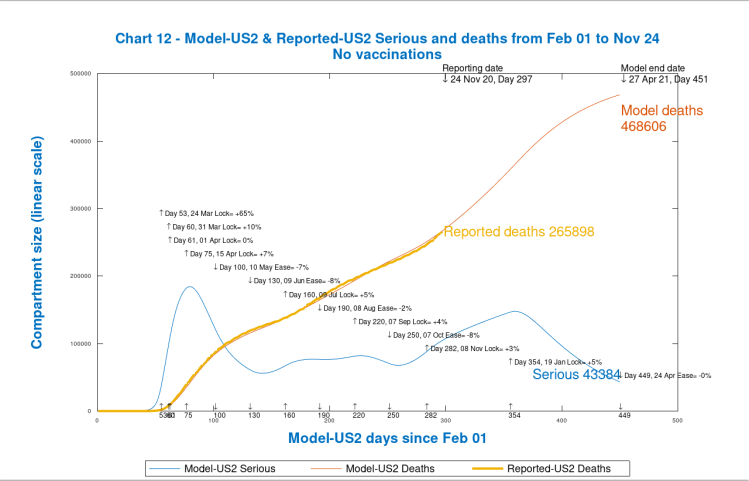
Base case for no vaccinations
For the base case, therefore, I have assumed that once Joe Biden takes up the Presidency, there would be an immediate (upwards) impact on conventional interventions (NPIs), with an additional 5% intervention effectiveness on January 20th 2021, irrespective of any vaccination opportunities; the following chart shows the current base case to 800 days under that assumption.
This first USA chart is purely for comparison purposes, since in the remaining 450 days or so of that 800 day period, following the Inauguration Day, other interventions would surely be made, following the first one I have presumed on January 20th (day 354 in my model), whether or not vaccination has started.

As we see, the cumulative modelled deaths at Day 800 reach 1/2 million, but my model isn’t alone in projecting such dire numbers. The University of Washington USA forecast out to March 1st 2021 (which would be Day 394 in my model), drawn from current data at the Worldometers USA web page, shows the following:
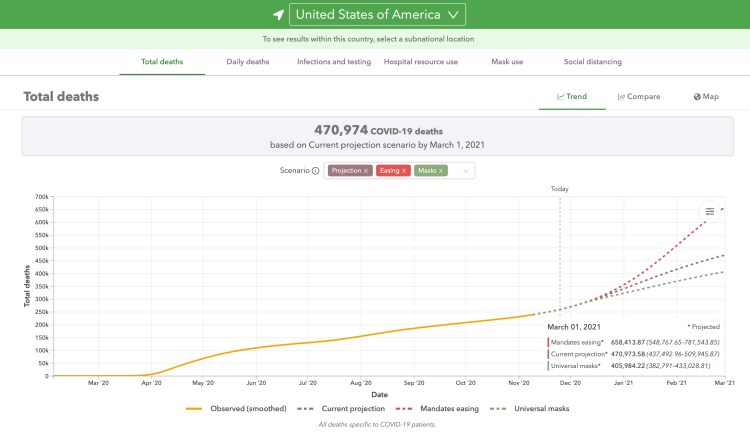
My model projection to 450 days (April 27th, 2021), for no vaccinations, also with the additional 5% intervention effectiveness on January 20th (Joe Biden’s Presidential Inauguration day), shows:
and so we see that the University of Washington projection and my model aren’t so far apart, as before, when I reported in my November 10th blog post. Assumptions, however, are probably somewhat different between their approach and mine, so interpretations of these charts should be made with caution. Three principal assumptions are shown on all of the University of Washington projections, and error ranges can be shown too.
January 1st USA vaccination with immediate high capacity
For vaccination scenarios, firstly I will present the equivalent “best” case that I considered first for the UK. For the USA, on January 1st 2021, vaccinations start at 1.5 million people per day at 95% efficacy. It’s possible that the vaccination rate would exceed that eventually, but for the shorter term, that might be the best to be expected. Here is the 450 day outlook for that case, to April 27th 2021, with other interventions (NPIs) remaining unaffected, as listed, in the body of the chart.
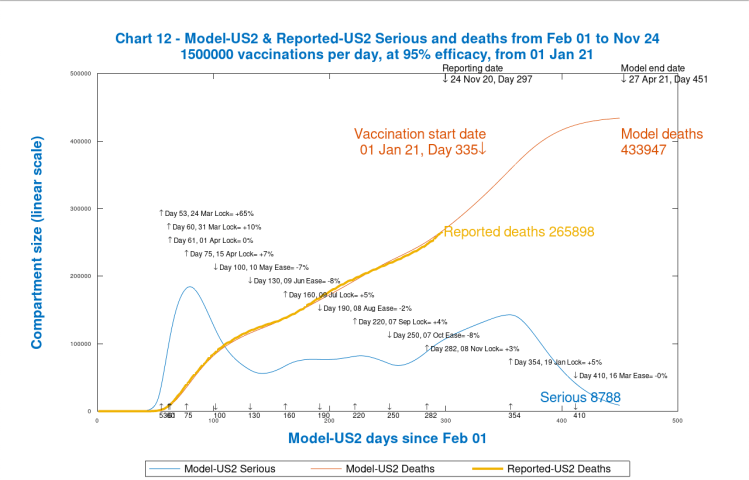
We see that the modelled cumulative deaths by Day 450 are 433,947, a reduction from 468,606, from the “no vaccination” case, of 34,659 saved lives. The deaths are still increasing at that point, so I show for completeness the equivalent 800 day projection, to 12th April 2022; as can be seen, modelled Seriously Sick and Deaths have ended well before then.
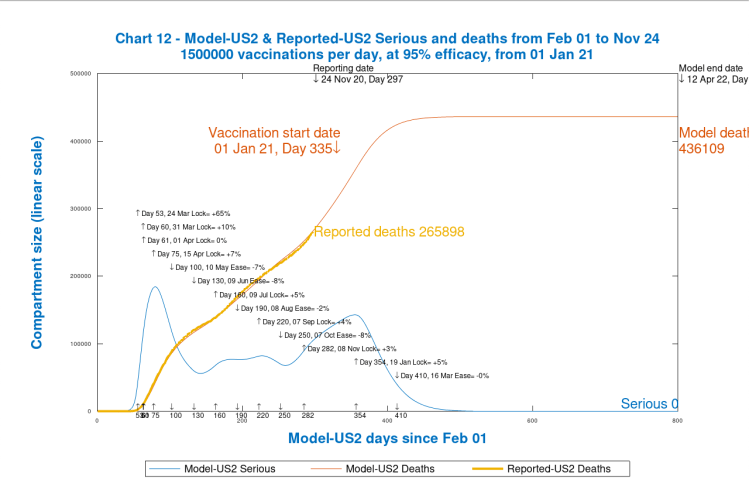
In this case, the modelled deaths after 800 days are 436,109, a difference of 63,925 saved lives in this “best case” 800-day outlook, compared with 500,034 in the unvaccinated case. As I mentioned before, other interventions would surely be made over such long period, but this shows what a vaccine can achieve given long enough to take effect.
USA sequential build-up of vaccination capacity
As for the UK case, I will build capacity for vaccination in three steps: 500,000/day at 70% efficacy from January 1st 2021; 1,000,000/day at 90% from February 1st 2021; and 1,500,000/day at 95% from March 17th 2021.
The first chart shows the projection for 450 days to 27th April 2021.
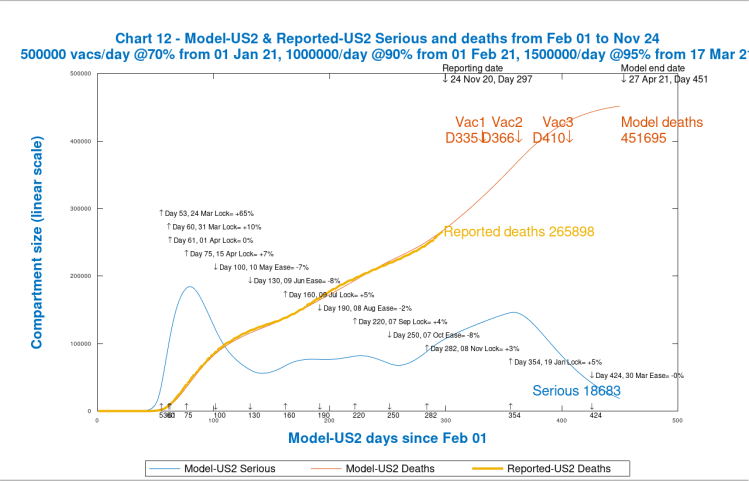
We see that compared with the base case for 450 days, we save (468,606 – 451,695) lives, or 16,911. This relatively low number (compared with the lives lost already) is because ramping up vaccination from day 335 and reporting the outcome on day 410 is a relatively short time to see the specific effect of the vaccine.
The projection out to day 800 (12th April 2022) shows a greater difference from the 800 day “no vaccination” case:
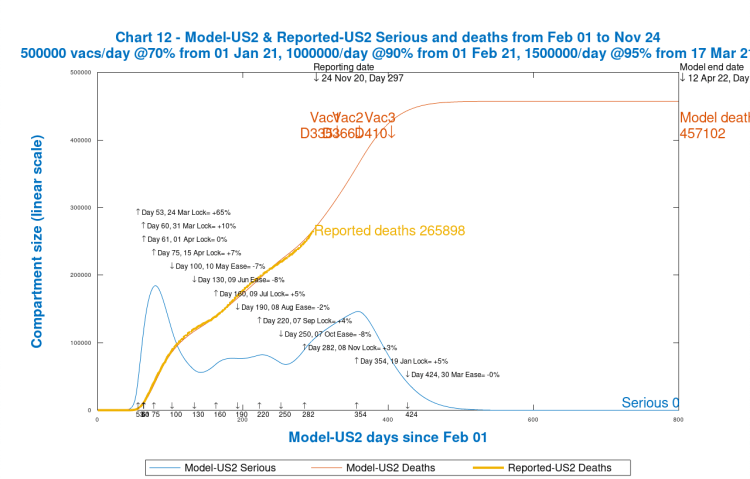
The cumulative deaths here, 457,102 compared with 500,034 for the base case, are a radical improvement (42,932 in terms of lives saved) although, as I have said, other actions would surely be taken after January 20th by incoming President Joe Biden (as he will be by then) in any circumstances.
Discussion of the modelling options
In all of the numbers presented, the numerical differences between model projections are likely to be a better measure of the effect of a vaccine than the individual forecast numbers themselves; any errors in model forecasts present as the full error when compared with reality, but taking the difference between model projections subtracts one error from another, reducing the absolute error in that difference (the lives saved) even if percentage error in that difference were the same.
Thus I think that the model numbers representing comparative improvements in death rates are more indicative than the forecasts of the death rates themselves.
I have also made quite a few assumptions (especially for the USA), yet to be calibrated by good evidence of the likely ramp-up in vaccination rates, vaccine efficacies, and, of course, the dates by when we might see the vaccination programmes start. For the UK I do, at least, have the numbers of centres the UK Government is planning, as well as the range of daily vaccination rates for each.
Vaccination discussion
As I complete this post, I am watching the Zoe Youtube broadcast “Ask the Experts” with Prof Tim Spector (of the Zoe Covid-19 app), Prof Peter Openshaw (of Imperial College Immunology department) hosted by Christina Hu (also at the Zoe Covid Symptom Study) about the current SARS-Cov-2 vaccines, and I couldn’t do better than suggest watching this broadcast to learn more about the development, approval, distribution and the effect of the different vaccines.
This includes an explanation of the much-quoted “T-cells”, which have to do with immunological memory, and therefore immunity duration, which are known to be encouraged by live vaccines (such as A-Z Oxford, Pfizer and Russian Sputnik V)) for SARS-Cov-2; the experts also compare the immunity conferred by the disease vs. a vaccine.
The RNA-based vaccines (Moderna and BionTech), however, are now also thought to encourage the development of active T-cells. But it is all very new, and more time is needed to explore all the characteristics.
In the presentation, immunologist Prof Peter Openshaw also stated that antibodies from a vaccine were “10, 100 or even 1000” times as much as from natural infection, and that the duration of immunity or protection rose with the amount of antibodies (or greater strength of any original infection). He used the word “proportional” as shorthand for this relationship between enhanced antibodies and enhanced protection.
He also felt, based on first principles, that RNA-derived vaccines (such as the Moderna and BionTech ones) might just be regarded as safer in some respects than the live-vaccine ones (Oxford/AZ, Pfizer and Russian Sputnik ones) for those with compromised or weak immune systems, although he felt that most people, even with immunity issues, apart from a very small minority, would also be fine with live-vaccine, .
Watch the video to be sure. As more is learned about Covid-19, the thinking about such at-risk groups has been changing in some cases.
When asked, both Prof. Openshaw and Prof. Spector said that they would take any of the vaccines whether RNA-based or live-vaccine, once through the safety agencies (the Medicines & Healthcare products Regulatory Agency in the UK). They would be keen to take any, but at present the live-vaccine is 10% the cost of the RNA versions; but this gap is likely to change fairly rapidly, according to Prof Openshaw.
Concluding thoughts
There are several vaccines in play at the moment, and different countries have come to different advance arrangements with different potential suppliers.
I have provided an outlook at this point, not only as a statement of where my thinking is, but also, of course, to gather any comments, clarifications or further information from readers.
I expect, in any case, that by mid-December, we will not only be more confident about the interventions Governments are making, and/or propose to make (or relax) over the festive season, but that we also might begin to see agency approval for one or more of the vaccines, and a schedule for roll-out.
I remain convinced that a vaccine is the only safe, effective and ethical way out of the SARS-Cov-2 epidemic, and the modelled rates of reduction compared with the present situation confirm that view, as does the “Ask the Experts” video.
I do hope that the estimates of efficacy are good, and that the requested approvals for use of the vaccines happens quickly.
But, if anything, safety is more important than efficacy, and so I would not want pressure brought to bear to short-circuit any such approvals.

5 thoughts on “Modelling of Coronavirus vaccine strategies”