
Introduction
In the news today, I read that Dolly Parton had given $1,000,000, through her Covid-19 Research Fund, to help fund the Moderna vaccine development. As The Times newspaper reported, this – erm – somewhat trumps the White House contribution to public safety. In her honour, Ryan Cordell composed and performed this ditty, which inspired my blog post title.
The timing neatly coincides with the work I have been doing to incorporate vaccination into my Coronavirus model, and to that end I have been researching ways of modelling vaccination.
I have made some appropriate changes, and run some model options for different vaccine efficacy values; vaccinations per day; and date of starting the vaccination programme.
Some model update options
In order to prepare for adding vaccination to my Coronavirus model, in expectation of the release of a vaccine and the initiation of a programme of vaccination in the UK (and in other countries) I have been researching ways of implementing of vaccination in a typical SIR model as discussed in my previous papers.
Good sources have been Maia Markcheva’s 2015 book “An Introduction to Mathematical Epidemiology”, and also Bill Schiesser’s excellent little volume “Computational Modeling of the Covid-19 Disease”, which, as might be guessed from its title, is a 2020 publication.
While Bill’s book contains some useful “R” code to implement a modification of a base SIR model disease transmission rate (with a negative exponential function) to reduce it over time, I prefer, for now, the approach of introducing an additional “V” compartment (V for “Vaccinated”) into my existing 7-Compartment model (from an original development by Alex de Visscher of Concordia University, Montreal) which has worked so well so far.
Maia Martcheva describes a version of this for a simpler 3-compartment SIS model (albeit with some “interesting” mathematics) and I have applied this approach to my 7-compartment model.
My model has already been amended to handle epidemic interventions at different times (through an intervention effectiveness and date array) and in October I have further updated it recently to handle adaptively triggered interventions, based on Seriously Sick thresholds.
Some vaccination mathematics
I won’t go into too much detail here (as I have written a full description on Google Docs here), but there are some interesting outcomes from incorporating vaccination into a model when the vaccine is assumed only to be partially effective. In such a case, the vaccine “efficacy”, e, lies between 0 and 1 (i.e. 0<e<1), where e=1 represents fully effective, and e=0 represents totally ineffective.
Recent trials of the Pfizer and Moderna vaccine options are said to be between 90% and 95% effective, ie 0.9 < e < .95, although full details of these results have not been released yet.
I have presented the mathematics fully in the Google Doc, (filling in some of the gaps from the Maia Martcheva book) where a couple of key questions can been answered thus:
Q1) For a fully effective vaccine, what vaccination percentage “p” of the population do we need to vaccinate to achieve to assure that the Reproduction Number for the vaccinated population, R=qR0<1, where q=(1-p), to control the epidemic?
Ans 1) This would require, equivalently:
(1-p)R0<1
or, rearranging,
p>(1-1/R0).
For a disease such as Covid-19, where the starting R0 value is between 2.5 and 4, say, the required proportion p is between (1-1/2.5) to (1-1/4) respectively; these two values are 60% and 75% respectively.
Q2) For a vaccine that has e<1, what is the critical proportion of people that should be vaccinated to ensure that the epidemic is controlled if the vaccine is “imperfect” and continuously applied?
Ans 2) It turns out that compared with the base case above, the required fraction p’ is given by:
p’=(1-1/R0)/e.
This expression is just 1/e of the value of p in the earlier case, for vaccination with perfect efficacy. This seems a little obvious now, but it did need to be proved, and my full paper shows the (quite long) derivation. Note that for e=1, the result is the same, as it should be.
I first covered the following aspect of Herd Immunity in some detail in my blog post on June 28th, where I quoted Dr Anthony Fauci’s assessment that 70-75% vaccine effectiveness would be needed. But if take-up of a vaccine were less than 100%, then the efficacy of the vaccine would need to be higher, since as we saw above, the necessary proportion is increased by just the inverse of the efficacy number. I rehearsed this derivation in my more recent post on October 21st asking where the exit from the pandemic might be.
As I said on June 28th “Presumably this might be why Dr Fauci would settle for a 70-75% effective vaccine (the H% number), but that would assume 100% take-up, or, if less than 100%, additional immunity acquired by people who have recovered from the infection. But that acquired immunity, if it exists (I’m guessing it probably would) is of unknown duration. So many unknowns.”
A counter-intuitive corollary
I haven’t probed the following matter a great deal, but it turns out mathematically, and this is quite important for vaccination programmes, that for an “imperfect” vaccine with e<1 (which most are), it can happen that the required R0 threshold (usually seen as R0<1 for control of most epidemics) Reproduction Number target is sometimes lower than usual, arising from a mathematical phenomenon known as “backwards bifurcation” in the solution set for the controlling differential equations.
This occurs when when the chart curve, plotting Infection rate against the R number, decreases at first, but then turns around and increases again for an R value which is still less than 1, and decreasing.
This arises in some cases when the disease treatment facilities, as represented in the model (which influence the recovery and death rates) are insufficient. This doesn’t show up in the same way when the vaccine is perfect (efficacy e=1) but only when e<1. I will look into this more as an adjunct to my vaccination modelling, but for now I will leave it to my model to make the projections (as it is based on the relevant mathematics).
Model changes – adding a V compartment
Details of the original model, complete with original code, are available in Alex’s paper from 22nd March 2020. I covered my base model on April 14th here, and the original epidemic flowchart between the seven compartments in that model is shown below. This flowchart comprises Uninfected, Incubation, Sick, Seriously Sick, Better, Recovered and Deceased compartments.

This is the model I have updated with Intervention actions and dates, and also with automatic adaptively triggered interventions. As I presented in my blog post on October 29th, my adaptive triggering uses the number of Seriously Sick individuals to set upper and lower thresholds for applying and relaxing, respectively, additional interventions. This next stage is to add vaccination capability to the model.
The approach I have taken is to add a V compartment, representing Vaccinated individuals, which is populated at the daily vaccination rate (r8, say) from the Uninfected Compartment U (assuming that ideally, only uninfected people are vaccinated, since vaccination makes no difference to those already infected or with antibodies) with a transition rate from V to the Infection Incubation compartment I at (1-e) times the usual rate of infection, r1, from the Uninfected compartment. This represents only the “ineffectively” vaccinated fraction of vaccinated individuals that can subsequently be infected.
See below the additional vaccination compartment, V, in red, with the compartment transition rates r8, r9 and r10, also in red, that I have added to the model:
The remainder of any Vaccinated individuals (a fraction e of the vaccinated individuals, effectively vaccinated) can pass to the Recovered compartment in the model. I show below, diagrammatically, the changes I have made for a vaccination capability.

These additional flows change the model differential equations a little, but this is simply changed (once the way of doing it has been worked out!) in the differential equation solver in the model (MatLab’s ODE45 iterative solver) to arrive at the new solution.
These new flows are as follows:
r8.U/P = vaccinations per day;
r9 = (1-e).r1.V/P,
where r1 is the usual infection rate per day per person, and e is the vaccination efficacy. For e=1 there is no flow to incubation, and for e=0, all vaccinated individuals are as able to be infected as anyone.
r10 = e.r1.V/P
is the flow rate from the vaccination compartment V to Recovered, V/P being the ratio of sizes of the Vaccination compartment to the total population P to adjust the rate in the equations, all evaluated at any time t (in days) in the model as the model progresses. This is just the remainder (the large majority, hopefully) of vaccinated individuals who don’t become infected and are destined for the Incubation compartment. Again, if e=1, all vaccinated people go to Recovery in the end, but if e=0, then there is no such flow to Recovered.
Running the vaccination model
I will use some of the settings I have used for recent updates to the model which I published in my most recent blog post on November 10th, so that outcomes can be compared.
I set the vaccine efficacy e at 90% for this run (although just today, Pfizer have announced that their vaccine efficacy is up from 90% to 95%, the level that the Moderna vaccine announced a couple of days ago). The Oxford Astra-Zeneca group hasn’t made and announcement yet, but it is thought to be imminent.
The model is set to run to 800 days; first of all, I run the base version for no vaccination, with the settings including all interventions up to and including the current lockdown in England, and parallel measures in the other home countries, plus a partial relaxation of those measures on December 2nd, as in my previous blog post, with 98090 deaths by 12th April 2022.

I next run the model as if a vaccine were available, which of course it wasn’t, at the initiation of the model (February 1st 2020) for the UK, but which calibrates the possible effect a vaccine can achieve over a long period.
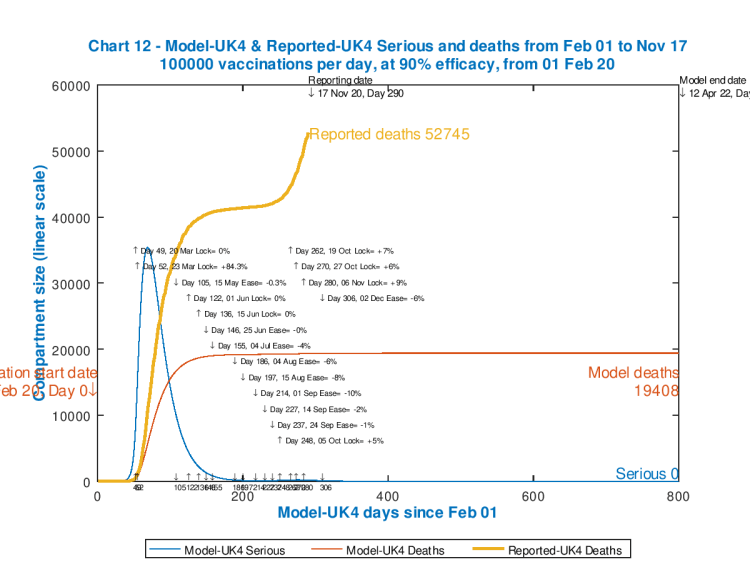
We see that even at 100,000 vaccinations per day (much less than the UK Government is planning), the previously modelled 98080 deaths for 12th April 2022 (Day 800) are significantly reduced to under 20,000, an outcome that Sir Patrick Vallance (the UK Chief Scientific Adviser) said, all that time ago in late March, would be a good result (a hope rapidly overtaken by events).
As far as vaccinations per day are concerned, I have seen estimates that could amount to 500,000 per day, reported here by UK’s The Guardian newspaper thus: “The new facilities will be additional to the 1,560 community-based vaccination centres run by GPs, which will each dispense 200 to 500 jabs a day”. I assumed an average of 350 for each centre in coming to c. 500,000 per day in broad terms.
For comparison, though, I firstly present three further charts for 100,000 vaccinations per day, still at 90% effectiveness, but for three later start dates: the unrealistic option of 1st December this year; then January 1st 2021; and, probably the most realistic of the options, February 1st 2021.


So we see that the February 1st start date option in the main chart on the left delivers about a 10% improvement on the base case of no vaccinations at all – 89,095 deaths compared with 98,080 at day 800, 12th April 2022.
The other two cases, December 1st and January 1st start dates (on the smaller charts at the right), do show somewhat greater improvements (82,776, and 86,296 deaths respectively) there being longer to reach more people with the vaccine, but it is either extremely unlikely (December 1st) or very unlikely (January 1st) that a vaccination programme could start at volume as early as those dates, even assuming the vaccines are approved in time.
I again show next the the outcome for the more realistic February 1st start date, but this time for 500,000 vaccinations per day, probably the best vaccination daily rate we could reasonably expect.

There is more improvement this time, at 84,184 deaths by Day 800. As the chart is essentially flat by Day 500, June 15th 2021, and modelled Seriously Sick patients are very low by then, nearly all of this vaccine initiated improvement should be seen by then – so here is the chart out to Day 500 to see that more definitively.

But, for day 500, in the base case with no vaccinations, the model shows that deaths have not yet plateaued, as follows, at 90,551 and still rising.
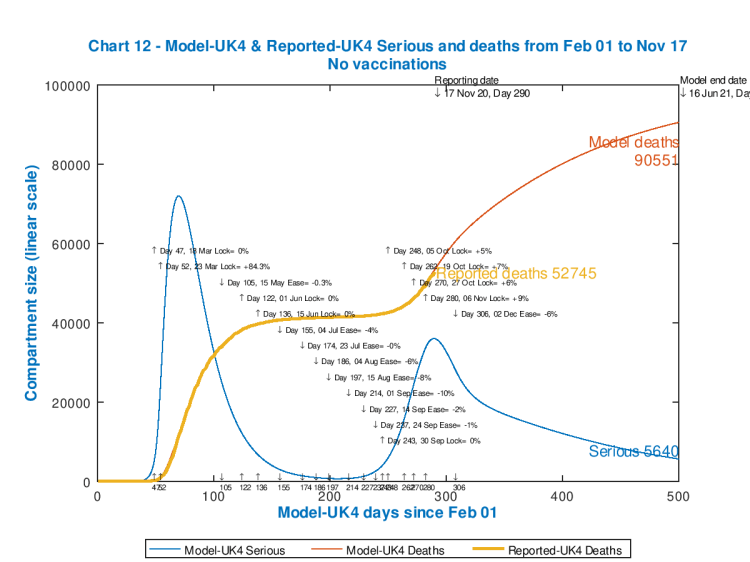
We see, then, from the last two charts, that compared with the base case with no vaccination, to day 500, that a 90% effective vaccine applied at the rate of 500,000 per day from February 1st 2021 might improve the model forecast for deaths from 90,551 down to 84,142, about a 7% improvement, by 16th June 2021.
In the longer term, the February 1st vaccination initiation improves the outlook from 98,080 deaths for no vaccination down to 84,184 deaths, about a 15% improvement.
If a vaccine were available at any time before February 1st 2021, the improvements in our situation could be slightly greater. As usual, with exponential or near-exponential epidemics, the earlier and more decisive action is taken the better.
Discussion
These are just model results. The comparisons between model forecasts are likely to be more useful, as between forecasts, than the comparison of forecasts with reality (even allowing that the model curve to date is precisely accurate, by adjustment of the intervention measures and dates.)
But the technique shows great promise, and is a clear indicator of the kind of advice Government(s) will be getting from their advisers, advice that will be much more fine-grained then I am able to provide.
Whilst I have run some models for the USA, I’m not ready with those yet, as I don’t have a feel yet for the likely vaccination rates they might achieve.
Concluding thoughts
As I have said consistently, a safe and effective vaccine is almost certainly the only credible, safe and timely way out of our current crisis situation with the pandemic, despite (as I have also said) the many suggestions that “herd-immunity” might be achieved through natural infection, rather than by other means. These suggestions have largely been rejected, by scientists whom I have mentioned positively in my recent blog pages, as being anywhere between unethical and unworkable.
Understanding the impact of a vaccine (including for how long any conferred immunity might last) is vital, although the assumption in my article here is that vaccination is “continuous” – i.e. that it would be reapplied as necessary – and this would probably be the case. Possibly “continual” is a better word.
I’ll try to report again next time on the USA situation, as well as continuing to refine the nature of my model.
In the meantime, I’ll spend a little more time listening to Country music in honour of Dolly Parton. I’m not going to return, however, to Microsoft Windows from my Apple MacBook Pro, in recognition of Bill Gates’ large financial contributions – there’s only so much one person can do!

7 thoughts on “Vaccine, vaccine, vaccine, vaciiiine,…(don’t refuse it, just because you can) Coronavirus”