Introduction
In a previous post on December 2nd, I cautiously welcomed “the end of the beginning”, and events since then have borne out the need for caution, with the discovery of a mutant variant of the SARS-Cov-2 virus (designated VOI-2012012/01 or VOC-202012/01, lineage B1.1.7. first identified in Kent on 20/09/2020) which seems to have a much greater transmission rate, as much as 70% more than the strain of SARS-Cov-2 we have seen previously in the UK.
Parts of the UK, especially in the South-East of England, have seen much greater daily rates of cases; and nationally, case and death rate growth has been persistent. Reports are tracking the increasing presence of the variant strain of the virus in most parts of the UK.
I have developed a further version of my Coronavirus model (to which I have added since the first version by Prof Alex de Visscher of Concordia University, Montreal), which now includes not only intervention capability (as described in Alex’s paper) but also a vaccination module I have added, as I reported on November 25th, and now the ability to add further virus strains with different transmission characteristics.
This first report is exploratory, and helps to indicate, if the new transmission rate is indeed 70% higher, and that most case growth in affected areas is owing to this new mutation, why the UK Government is so concerned.
The Government has, by now, suspended most of the intended UK Christmas relaxations (although I have assumed some variation from that, as well some New Year “indiscipline” on the part of the public) and it seems likely that even more severe interventions will be imposed in the New Year.
I have made such assumptions in the model versions I will present, not as forecasts, but as comparative scenarios that show how sensitive the future, as predicted by the model, is to near-term changes in the epidemic characteristics, and to the Non Pharmaceutical Interventions (NPIs) and, hopefully, to the all-important pharmaceutical one, the vaccine).
The vaccine rollout is present in all of the models, but its effect will take time, and in the scenarios with greater infection rates, the vaccination rate will be reduced to some extent, as it is assumed that only uninfected individuals are vaccinated.
It’s a complicated situation with lots of moving parts, and I can only address, in a brief outlook paper, just a few of the parameters. I shall present several cases with cumulative assumptions about interventions, their timing, the rate of vaccine rollout and the additional transmission rate of the new virus mutation.
Assumptions
I have assumed the same vaccine delivery rate as before. As I write this, the UK has delivered its first 0.5m vaccine doses in two weeks, and so my rates of 100k/day from Jan 1st, 200k/day from Feb 1st and 300k/day from March 17th are probably a little optimistic.
Full protection (and therefore the full contributory effect on the epidemic) isn’t until 7 days after the second dose, which is three weeks after the first. But I guess all efforts will be redoubled to accelerate the delivery rate, especially given the new situation
I have also assumed the original virus transmission rate (k11 in the model) of k11 = 0.39/day from February 1st, as before, but with an increase (for the scenarios where I have included it) to k11 = 0.663/day after December 16th when the early reports (from September) were confirmed. Case rates were already high, especially in London and the South-East, and it was stated that 40% of the increased case rate in London was caused by the new strain of the virus, a proportion that was growing.
It also seems to be reaching other parts of the country, as I show here for the relative positive test % incidence (to December 17th); and there are reports of it in other countries too.

I am guessing that the scenarios I present are the kind of thing (in principle, if not in the quantum of the changes) that the SPI-M advisers have indicated to Government through the SAGE Committee. Prof Chris Whitty (UK Chief Medical Officer, CMO) and Sir Patrick Vallance (UK Chief Scientific Adviser, CSA) have made it clear that they are extremely concerned by this development.
I have seen some comments that the UK Government is overreacting, but others feel that action might have been taken a little too late; and some felt that the Christmas arrangements were always too risky, given the case and death growth rates. It seems that at least for the case rate, this new strain of the virus might have been the underlying cause, although from a death rate standpoint, advisers have been keen to emphasise that the strain does not seem more virulent.

Hence, so far, I have left the fatality rates in my model as they were, and adjusted only the infection rate from December 16th (I only model one rate at a time, not two simultaneous viruses). It would be possible to set transmission rates on a sliding scale, at a series of dates, but for the time being I have just switched from one transmission rate to the other; 0.39 to 0.663 (=1.7 x 0.39) on December 17th in these model runs.
This isn’t so unreasonable. In her book “An Introduction to Mathematical Epidemiology”, which I referenced on November 18th for my vaccination model, Prof Maia Martcheva outlines (p183 pp) the “Competitive Exclusion Principle” that for many multiple virus strain scenarios, a strain with higher R0 value will supersede those with lower R0, as a result of competition between them to infect susceptible individuals.
Given the 70% increase in transmission rate of the new variant, the corresponding R0 will also be 70% higher than the original.
My analysis so far is only for the UK, both because the new variant (or strain) seems more prevalent here, and also because the UK is the first country to administer a vaccine.
Scenarios without the new strain of the virus
First, a couple of scenarios to show the relative effect of two NPI (Non Pharmaceutical Intervention) strategies in the New Year, following the relaxation programme over Christmas in New Year; it’s my assessment of a combination of relaxed Government guidelines and less than complete public compliance.
Base case
I will start with a scenario that reflects increased changes in the cases and death rates previous since my December 11th blog post, up until December 20th, as a kind of baseline.
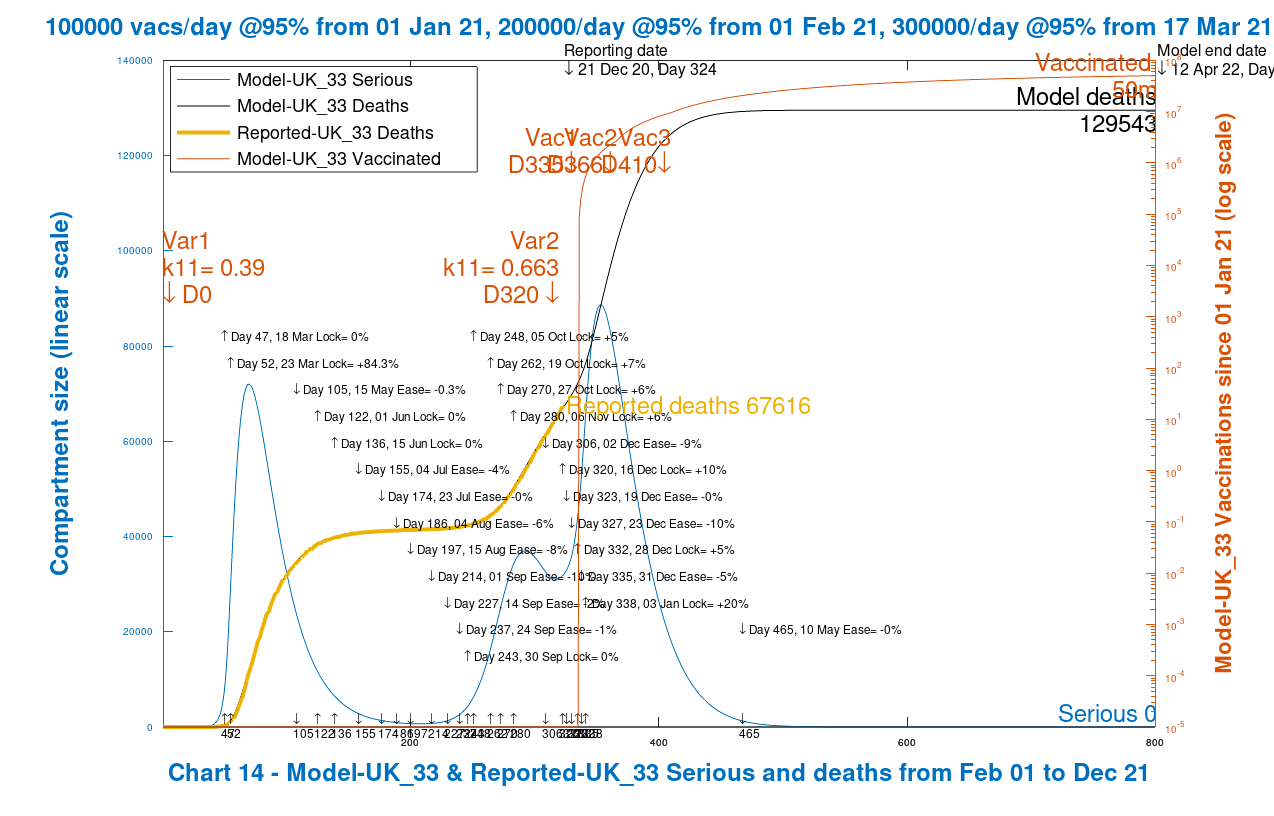
I will confine all the results I present to versions of this chart, Chart 14, to simplify comparison of the model scenarios. It shows the outlook for Serious cases and Deaths, with the Reported Deaths to date (December 20th) superimposed on the modelled curve, showing the good fit of the model with reported numbers to date. It also shows vaccination rate change dates, and the virus variant start dates. In this scenario there is just the original Sars-Cov-2 virus.

This would be the base case before the December 16th tightening of the Tier arrangements in the UK, and the announcement of the new virus variant. Case rates had begun to increase in the UK, persistently, and the new virus variant probably explains much of the later impact on case rates, particularly in London and the South-East.
There is a small additional peak shown by this model in Seriously Sick cases after New Year.
Note that 51m people have been vaccinated by Day 800 (starting on Day 335, 1st January. It is assumed in the model that only uninfected people are vaccinated.
The UK Government’s response to rising case rates
In the period just prior to the latest announcements regarding the new strain of the virus, the UK Government had taken action to reinforce and enhance the intervention Tier levels around England (with parallel changes in the other home countries, Scotland, Wales and Northern Ireland), and I have represented that by adding a 10% increase in NPIs on December 16th.

The effect of this can be seen below, compared with the base case, with the same post-New-Year NPI effectiveness increase by 20%.
It brings the modelled outlook approximately back to where the situation was on December 11th, but with a higher cases and deaths rate to date, balanced, going forward, by the additional Tier adjustments made around the 16th December.
There is flattening of the Seriously Sick curve over the festive period (even with the relaxations that I have applied in the model to reflect partial easing of measures) which then declines as the additional post-New-Year measures take effect.
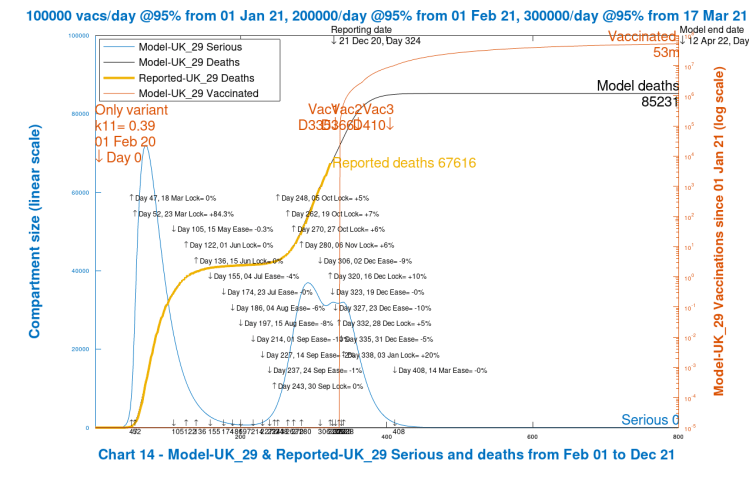
This would be the best case, and we see that as well as the the January peak in Seriously Sick being flattened, there are much reduced cumulative deaths. This does not yet, however, include the higher transmission rate estimated for the new variant of the virus (named VUI-202012/01).
The effect of lower early New Year NPIs
To highlight the effect on the scenarios above of the 20% enhancement in NPIs included in them for January 3rd, reflecting a set of post-festive-period measures much nearer to lockdown, I now show scenarios with just a 10% uplift in NPIs at that same date, January 3rd 2021. First, the case also including 10% uplift on December 16th, as in the best case scenario above.
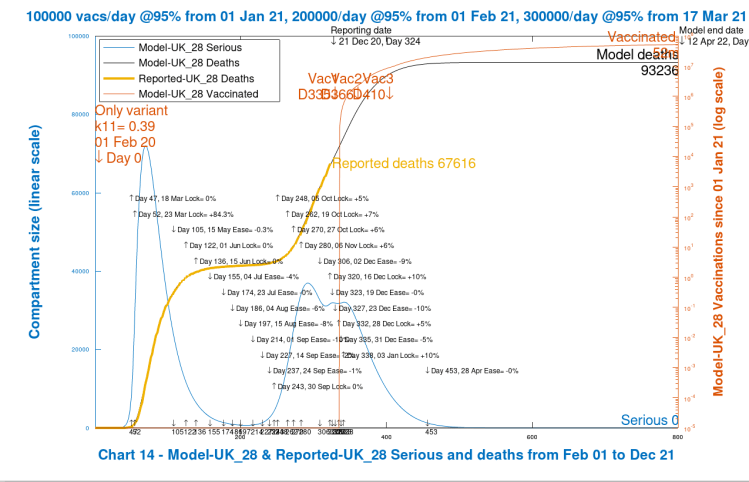
We see an increase in cumulative deaths, but the Seriously Sick numbers immediately following Christmas and New Year are still under control, because the reduction in NPIs is just at that point, and therefore takes effect only later, showing up as a slower decline in infection rates (indicated by the Seriously Sick curve) than for the 20% scenario, and with a higher death rate.
The effect of lower pre-Christmas NPIs
I now remove the pre-Christmas 16th December NPI enhancement (just to see the effect on the model, even though that uplift was in line with Government measures taken at that time).
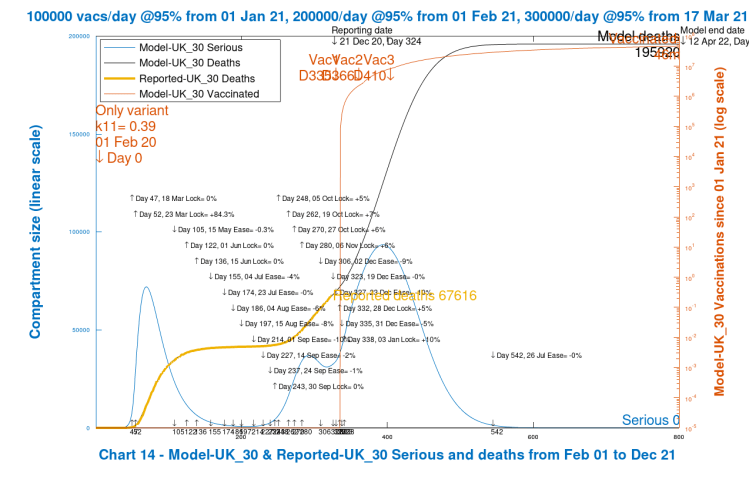
There is now a very large peak starting in January in Serious Cases of 90,000 or so, compared with an earlier peak of about 55,000 in the base and best cases. This is followed by a sharp increase in the eventual cumulative deaths, more than a doubling of the previous case.
Control of the epidemic has been lost in the Christmas/New Year period, and although recovered eventually, it takes much longer in this scenario, with the lower % Intervention Effectiveness (NPIs) on both December 16th (zero instead of +10%) and on January 3rd (+10% instead of +20%).
The relative difference between that chart and the previous ones indicates why Government was determined to make further adjustments to the Tier levels at that time.
Scenarios with the VUI-202012/01 strain of the virus
A short history of the new strain of Covid follows; Government states that scientists and advisers presented the implications just a few days ago, leading to the near-complete reversal of their festive season relaxations.

Worst case with minimal NPIs and the new strain of the virus
The first variant scenario, purely to show model behaviour in the absolutely worst case, which develops the chart immediately above, shows the effect of the postulated impact of the new strain of the virus when insufficient control measures are taken. The early New Year January 3rd NPI measures are set at 10%, and there are also no December 16th enhanced intervention Tier measures.
There is a very steep increase in Seriously Sick cases – peaking over 1 million – and correspondingly the cumulative death rate follows. It shows that the modelled outcomes are very sensitive to the enhanced transmission rate of the new strain of the virus, and also the to the NPI measures (or lack of them) to control it.
This IS an unrealistic scenario (based on much-reduced intervention parameters), and merely sets the upper bound to the modelling outcomes.
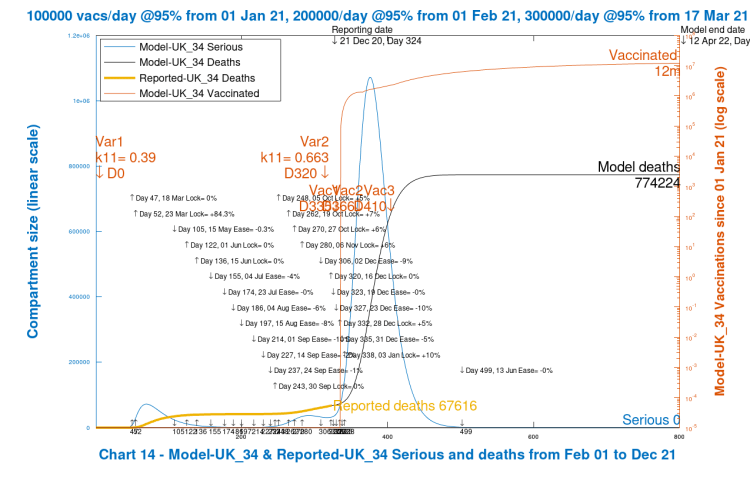
Note that in the chart above, vaccinations have reduced to just 12 million even by April 2022, because as the model assumes that only uninfected individuals are vaccinated, there simply aren’t enough uninfected individuals (in the model) to allow the vaccination rate to rise above that in that period.
Increasing the post-New-Year NPIs only
I have added this case just to compare the difference between the 10% increase after New Year (above) with the originally postulated 20% 3rd January uplift.
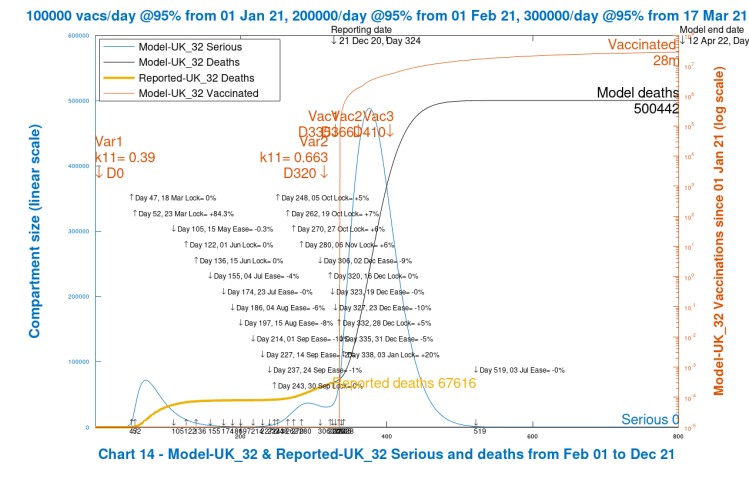
This change halves the Seriously Sick peak to under 1/2 million, and the long term outlook for deaths by a third. This is still just a theoretical scenario to test the direction of travel of the model against trial parameters.
Note that total vaccinations, by 800 days, are still only at 28 million in this scenario, still too small a fraction of the population to have a sustainable effect.
Community Immunity
70% of the 67 million UK population was regarded as a community immunity target, or 47 million, for the original strain of SARS-Cov-2.
For this new strain, whose transmission rate is assumed to be 70% higher than the original, the R0 value will be correspondingly 70% higher (virulence assumed to be the same) and so the range of R0 I have used in previous explanations of community immunity (aka herd immunity), for example in my June 28th blog post, where I discuss it in detail, the R0 of 2.5 to 4 would be increased to an R0 of about 4 to 6.5 for the new variant.
Thus the range of herd immunity % requirement for the new variant virus, given by H% = (1-1/R0)x100% becomes, instead of a range 60% to 75%, something more like 75% to 85%.
While those who have been infected would retain some immunity, neither natural immunity or immunity conferred from a vaccine is of known duration; for certainty and consistency, the intention would be for the vast majority of the population to be vaccinated, probably annually.
At this H% requirement of 75-85%, but with a vaccine of imperfect efficacy, even as high as 95%, we are in the realms of a required population vaccination percentage of 80% – 90%, an achievement very much at risk from the antivaxxer propagandists. I discussed the impact on community immunity outcomes of an imperfect vaccine in my November 18th blog post.
Increasing the pre-Christmas NPIs
The next step is to reinstate the measures actually taken just prior to when the new strain of the virus was made public, December 16th, to strengthen and apply the Tier 3 measures more widely. I have, though, reduced the January 3rd enhancement back to +10%, to continue to take a step-wise approach to my final scenario.
This has a large effect, halving the cumulative longer term deaths compared with the worst case at 800 days, following a reduction in Seriously Sick patients to a peak of under 300,000, a third of the worst case figure.

Increasing the post New Year NPIs
We can now move on to a more realistic scenario in the context of the new VUI-202012/01 variant of the SARS-Cov-2 virus, having explored the relative effect of the NPIs going forward.
As part of the announcements of December 20th, it became clear that there would be the prospect of further severe measures after New Year, with even the return to schools being under review. In the new variant model, I raise the NPI effectiveness from +10% to +20%, as well as retaining the pre-Christmas increase, and this again has a marked effect.

We now see that the NPI measures have a real impact on the longer term behaviour of the epidemic, with cumulative deaths in the long term under 130,000, and the short term peak in Seriously Sick reduced to 90,000 or so.
Over the long term I expect the vaccination part of the model to have an increasing effect, of course, and in this scenario vaccinations at the 800 Day point – 12th April 2022 – are back up to 50 million, well above the kind of percentage (70%) of the population required for community immunity for the original virus, but maybe not for the new strain, which might require between 80% to 90% of 67m people in the UK, or from 53m to 60m people.
Worldometers comparison
The University of Washington (Seattle), who take reported data from the Worldometers UK site (as I do) provide comprehensive daily analysis and charts of the current data for any country, and their UK analysis is here. As I did last time, I present their current forecast, which follows, to compare with my “realistic” scenario for April 1st 2021.
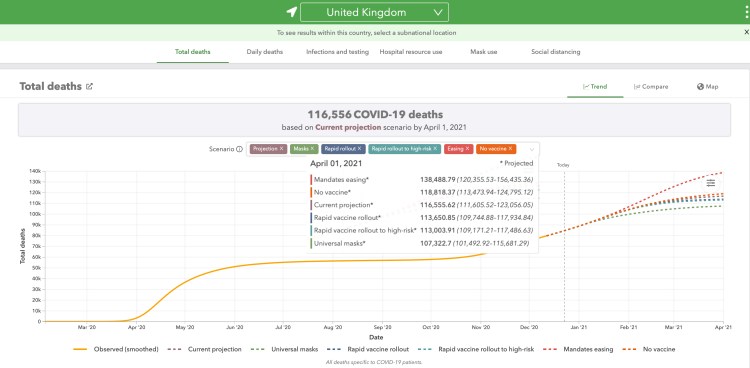
We see that their forecasts (apart from the “mandates easing”, which is not at all likely) are more optimistic than my “realistic” scenario, but they won’t have built in the new variant virus strain as I have. The assumptions (at December 10th) are in the University of Washington UK briefing notes here.
In my modelling of the new strain of the virus, I have applied the full 70% extra transmission rate for it from the start on Day 320 (16th December). Although it was present from at the latest on September 20th, two months earlier, by the 16th December it might have been responsible for 40% of the increased rate of infection in London and Kent in the South-East of England.
So my start date is later, but the enhanced infection rate is immediate at that point. I guess this would be somewhat pessimistic. Conversely, I think the University of Washington outlook will be optimistic until they build in the rate for the new variant in the UK.
My equivalent April 1st 2021 “realistic” scenario is here, and as far as April 1st 2021, of course, is identical to my 800-day version above.

As we see, comparing with my previous 800-day outlook above, which uses the same settings, the situation at April 1st 2021 should be a good indicator of the longer term, provided there isn’t further bad news (see, however, my Concluding Thoughts below). All of the forecasts for deaths, well into 6 figures, are sobering.
Discussion
It is easy to see from all of this why the UK Government are so worried about the situation. It was recognised that in an epidemic, early and decisive action is necessary to make a difference, learning their lesson from earlier delays in March and October, owing to the near-exponential behaviour of the infection.
On reflection one could ask why the festive period relaxations were announced quite so early; but allowing that family, social and economic life has been so traumatised through 2020, some gesture must have been felt to be needed.
Persistent increases in cases and deaths in the last few weeks, far from reducing, have increased further. While being, possibly, somewhat sub-exponential (the definition of exponential growth might be stated as “increasing by a fixed ratio in every fixed period” (e.g. doubling every week), until interventions take effect), they are very likely to have their roots in this new virus variant.
This has convinced advisers (SPI-M), and then the SAGE Committee, and finally the Government (who make the decisions) that the planned relaxations could not be sustained in the face of this new threat and driver for the increasing rates of infection and deaths.
Only a few of my charts in this post reflect feasible outcomes; the others, as described, are to explore and illuminate the behaviour and sensitivity of the model, and to arrive at a realistic scenario with more confidence, seeing the outcomes in the context of the sensitivity to input parameters.
Concluding thoughts
As I write this, the Government has just announced the geographical widening of Tier 4 interventions to take effect on Boxing Day, December 26th, in the UK. This blog post will, no doubt, need another update, quite soon, once the policy becomes clearer for the near term as a whole.
As far as the epidemic is concerned, we also need to understand more about the transmission rates, any age dependencies and whether any of the clinical consequences might be different, including any possible impact on the efficacies of the vaccines so far developed.
Finally, another new variant (501v2 or UK VOC122020/02, lineage B1.351 or 501Y.V2) has just been discovered, linked to contacts from South Africa, and further measures are to be put in place in the UK to force quarantining of such contacts in the UK; the possibly of putting such provisions into law has been mentioned.
My next development will be further to examine the compartmental restructuring of my model, as described by Prof Maia Martcheva in Chapter 8 of her book (p183 pp) the “Competitive Exclusion Principle“, since we soon might be confronted with simultaneous multiple strains of SARS-Cov-2.
Such restructuring would be similar to that I described in my blog post on November 18th for the vaccination module.
Finally – as far as vaccination is concerned, if, as I have indicated above, the required % of population to be vaccinated is between 80% and 90%, then as I said in the sub-title of my 18th November blog post, about the need for the vaccine to be taken, and as Dolly Parton might have put it, “don’t refuse it, just because you can”.

4 thoughts on “Exploring the possible impact of the new variant Coronavirus”