
Introduction
The UK Office of National Statistics (ONS) announced recently that with effect from March 24th 2023, it was ceasing publication of the regular cases and deaths outcomes of the UK Covid-19 pandemic.
ONS then revised all of its previously published Covid data. By making changes to some of my model’s data, re-working some of the early Variant characteristics in the model, I was able to bring its results into line with the new ONS data history of the pandemic in the UK. This post reports the outcomes of that work, as usual presenting a forecast up to March 2024.
Problem with ONS reporting cessation
Not long before my most recent post regarding my modelling of the UK’s Covid-19’s Coronavirus outbreak, on April 15th 2023, the UK Office of National Statistics (ONS) had announced on this website page that it was ceasing publication of its regular cases and deaths surveys of the UK Covid-19 pandemic, as of 24th March 2023.
I remarked in that post that UK reporting of Covid-19 cases and deaths seemed to have been skewed since rather earlier than that, from mid-March 2023.
Furthermore, after that post, later in April, the ONS went on to re-present all UK Covid-19 statistics, from the outset in March 2020 up until that reissue of the data on 20th April 2023. They had occasionally re-presented and corrected a few results over the period of the pandemic, but this was a wholesale change in all of the UK Covid-19 statistics for the whole period of the pandemic.
This was very surprising, and had the effect of rendering my (or anyone else’s) UK Covid-19 modelling for the whole pandemic somewhat inconsistent with the revised ONS data.
I was able, however, to bring my model’s history into line with the new ONS figures, principally by re-working some of the early variant characteristics in my model.
This post reports the outcomes of that work, while explaining how the new ONS data affected the model – but not why the ONS made the global change, and why it was so belatedly late.
I present three of my current model outcomes, which seem to show that although the ONS ceased its Covid-19 Deaths reporting back in mid-March 2023, they seem to have maintained (to date) partial, and apparently inaccurate reporting of Covid-19 Active Cases. It’s a confusing picture, and one that discourages me from relying on any ONS Covid-19 reporting beyond March 16th 2023.
The evidence of ONS changes in my model
I said in my most recent report on April 15th (“Official UK Coronavirus reporting ends“), that since about mid- March, UK Government reporting, as picked up by Worldometer, which I use to calibrate my model with Reported Data on Deaths and Active cases, seemed to have ceased.
Other public commentary (such as this one) indeed confirms that UK Government Covid-19 updates paused as of the end of March 2023, although my own observations (through my data gathering that supports my model reports) suggest that official UK Government reported data (through the Office of National Statistics (ONS) started to become less consistent from somewhat earlier, on March 16th.
One ONS announcement (see below) had also suggested that reporting had already become weekly rather than daily, so it has been a slightly unclear end to the provision of UK official Covid public data.
The relevant UK Office for National Statistics (ONS) page stated that “This page is no longer being updated. The final weekly [my italics] Coronavirus (COVID-19) Infection Survey release was published on 24 March 2023. Please search the ONS release calendar for the most recent ONS releases.“
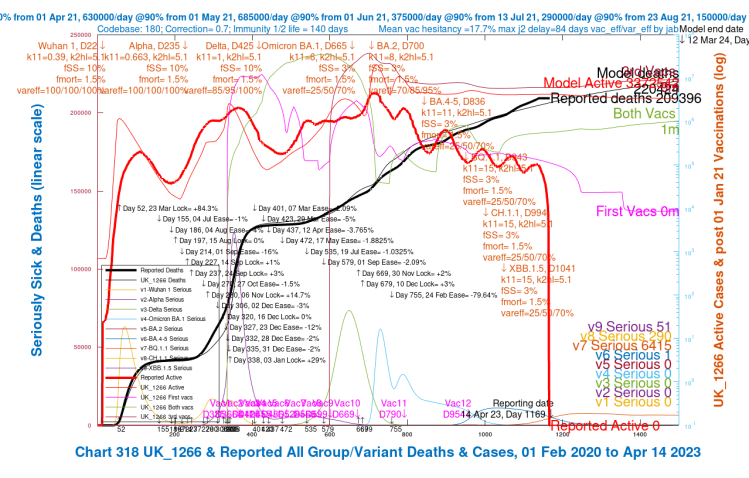
But my own model and charts initially indicated that daily ONS Deaths reporting stopped in mid-March; and then, over the next few days, Active Cases reporting reduced rapidly to zero, as you will see from my April 14th chart below, based, as usual, on ONS UK Coronavirus data as presented at Worldometer.
Note the precipitous fall in the heavy red line, the Reported Active Cases, in my model Chart 318 below, from 14th April 2023. This Reported Active Cases curve had been falling rapidly from at least as early as mid-March, showing that the steep fall in ONS Reported Active Cases went on for at least a month, from mid-March to mid-April, as we see below.
Also note that another feature of this cessation of UK Covid official ONS reporting is that the Reported Deaths (the heavy black curve in Chart 318 below) had “flatlined” from mid-March. Checking at the Worldometer UK website, from where I draw the Deaths and Active Cases data, that “flatline” date seems now to have been April 30th.
I suppose that as data was corrected later on, there might then have been some concomitant post-hoc reporting by ONS, beyond the initial ending of their data reporting period that they had announced above.
ONS re-present their historic data 20th April
This ONS Active Cases reporting error went on until 19th April; but then on 20th April, ONS globally altered all three years of their reported data, presumably suggesting that their reported infection Survey data had been in error ever since March 2020, or even before.
Maybe ONS also added later data for some days subsequent to the mid-March point I had earlier identified as the cessation of reliable ONS reporting, since some UK Covid-19 Deaths data now seems to be present at Worldometer UK up to April 30th, with Active Cases data continuing somewhat later.
The ONS April 20th revised figures showed that Active Cases were actually running NOT at zero, but at nearly 100,000 (94,343), although on a downward trend, as you can see from my 20th April Chart 318, showing the effect of those ONS reporting changes.
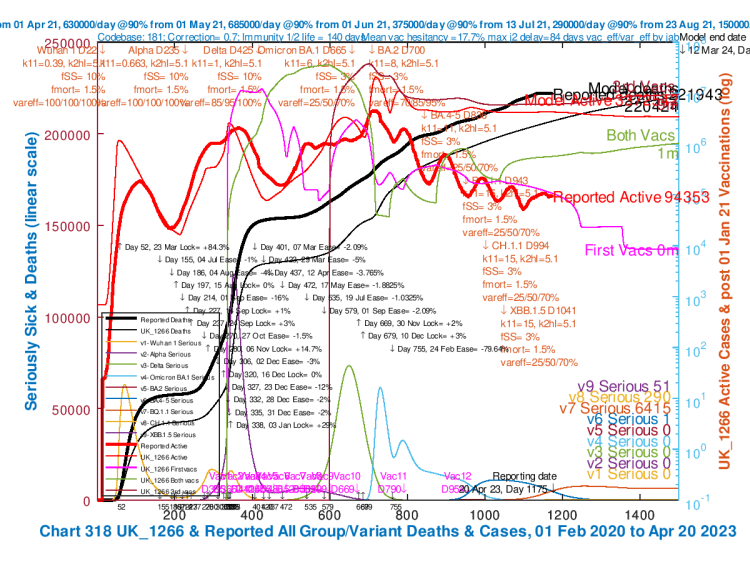
I should mention that the thin red curve in this chart, my Model Active Cases, which had been in fairly good alignment with Reported Active Cases (the heavy red curve) up until about February 2022, had then started consistently to exceed the Reported Active Cases curve, something that had made we wonder about the ONS infection survey results since then. But that discussion is for another day!
I have always regarded the modelling of Deaths as a) more critical, and b) more likely to be based on accurate publicly Reported Deaths data (despite my concerns expressed in this article).
As you see, the precipitous (and erroneous) fall in Reported Active Cases has been removed (thanks to ONS’ revision of at least the recent data), but that also their revision of the whole history of Reported Deaths (the heavy black curve) has diverged from my (unchanged) Model Deaths (the lighter black curve) from February 2020 to the present day. You can see the difference by comparing with the immediately previous chart.
Please note that the decline of Active Cases in the “wave” pattern we see in the charts (the heavy red curve) is not unusual in pandemic declines, as explained to me by Prof. Graham Medley* of the London School of Hygiene and Tropical Medicine, and as I mentioned (with his helpful explanation) here in my previous post on 9th February, entitled “The Kraken Wakes“.
[*Prof. Medley has chaired the SPI-M modelling subgroup of the UK Government’s Scientific Advisory Group for Emergencies, SAGE.]
Such wide-ranging ONS reporting changes, as demonstrated by my charts above, from mid-March to mid-April this year, can make modelling quite difficult. Maybe their eye was (and maybe still is, and forever) off this particular ball, now that vaccines are saving the UK from an even higher rate of cases and deaths than we had seen before, and following the ONS cessation of reporting.
I am sure that without vaccines, made available from the beginning of 2021, we would have seen a far greater number of deaths from Covid-19.
Model data revisions to cope with new ONS data
The ONS restatement of all Active Cases and Deaths for all three years of the pandemic appeared at first sight to be very difficult to cope with, but after a while I realised that a few small changes to my model’s Variant characteristics would help address the problem.
I don’t know, of course, what underlying changes the ONS had made to collection, collation and reporting of their Infection Survey data, but with the changes I have made, my model is is now consistent with the revised ONS reporting – which I have to rely on as the UK’s relevant, official and independent statement of the UK Covid-19 pandemic outcomes.
I show below an updated Chart 318 from 28th May 2023, with my first revisions to the variant mortalities fmort for the earliest three UK variants 1 (Wuhan), 2 (Alpha) and 3 (Delta), to bring the history of my model more into line with the new ONS data for the whole of the pandemic period.
I also took the opportunity to increase the vaccine efficacy for later variants; but the primary cause of the extended model fit issue, up to the emergence of the later Omicron variants, was the ONS data revision.

The historic fit of the model wasn’t yet perfect at this point, but it was pretty close, thanks to the adjustment of my model’s Variant mortality variable fmort for the first three variants, shown in the blocks of red text (one for each of nine variants in the model) in the body of the chart, up to 1.8% from 1.5%.
I have since reverted the Delta mortality fmort back to its original value of 1.5%, and this has again improved the model fit, as you will see below in the later charts in this article.
As mentioned, I had taken the opportunity also to increase the vaccine variant efficacy vareff for Omicron variants BA.1, BA 4-5, BQ 1.1, CH 1.1 and XBB.1.5, from 25/50/70% up to 70/85/95% (as it already was for BA.2) for 1, 2 and 3rd/subsequent vaccine jabs respectively, since the vaccine has proven to be more effective for these variants than I had prudently (pessimistically) allowed initially.
I had been cautious because there had been fears that later variants might prove to be more “evasive” from the vaccines, and so I had allowed for that earlier on, so that my model wouldn’t be optimistic (better to be cautious then bullish, I thought); but the vaccine seems to have been about as effective for those as for the earlier variants.
The most recent runs of my model (codebase 189), with those data tweaks, remain close to the reported outcomes from Covid-19, as we will see in the next sections.
Current model reports and outlook
We should still take care to interpret my model results, if only because they can only be as good as the ONS data (obtained from Worldometer as a consistent source) used to drive them. I’m also modest (experienced!) enough to realise that in my 10,000 lines of model code, not everything is going to be right.
On the Worldometer UK website, we see there are no new UK cases reported since May 25th, and so it should not be surprising that that Active Cases are declining monotonically, from that point, given the Covid-19 infection recovery rate of two weeks or so, when there are no new cases in the UK reported data from May 25th.
I run the model every day, with many different datasets over the years of the pandemic, to monitor its outcomes. My codebase is up to version 189 now, used for the charts below; note that earlier in this post, the first two charts are from codebases 180 and 181, with Covid datasets UK_1266 and UK_1271; I continue to keep the code and parameter datasets under review as I run the model daily.
Three model runs with different v1/v2 mortalities
I am currently running three datasets for my model each day, which differ only in the mortalities for Variants 1 and 2, the Wuhan and and Alpha variants. Changes to these variant characteristics amend the outcomes, even though they are eventually superseded by Variants 3 to 9, whose data remain unchanged. See the outcomes for the three datasets below.
Model dataset UK_1277 outcomes
This dataset has Wuhan and Alpha variant mortalities fmort at 2.0% and 1.61% respectively.

This dataset UK_1277 produces the closest overall historic fit to ONS Reported Deaths data. But because ONS have ceased reporting the UK Covid-19 data, it will be difficult to continue to calibrate the model to the Deaths and Active Cases statistics. The recent flatline in ONS Reported Deaths (the heavy black curve) also makes it hard to guess where that should have been, and where it is going (other than from the model itself).
In that sense the model helps inform us about the future of the pandemic in the UK, at least for a while.
Model dataset UK_1278 outcomes
This UK_1278 dataset has Wuhan and Alpha variant mortalities fmort at 2.1% and 1.61% respectively.
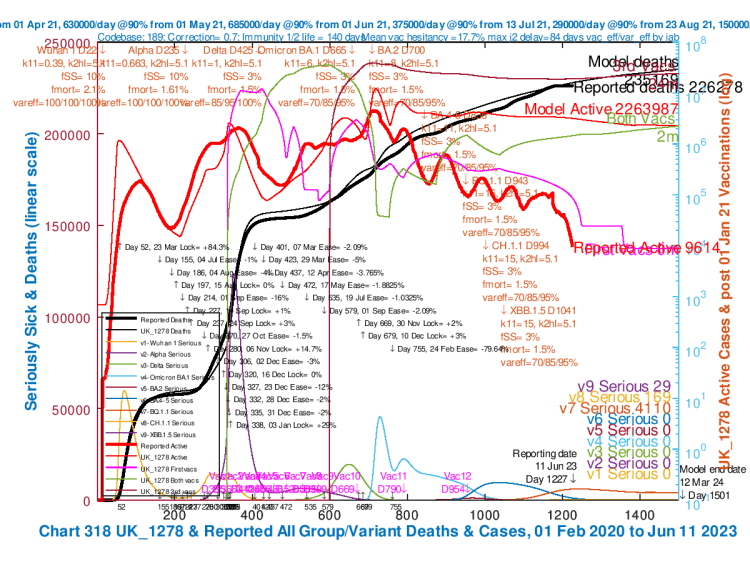
Although the Model Deaths run somewhat higher from early 2021 than Reported Deaths in this Chart 318, it may well be that the modelled curve (the thin black curve) will be a better predictor of deaths going forward from today. It will be hard to confirm, as the ONS are not reporting these numbers currently.
Model dataset UK_1279 outcomes
This UK_1279 dataset has Wuhan and Alpha variant mortalities fmort at 2.1% and 1.65% respectively.

We see that the Model Deaths are yet further ahead of Reported Deaths historically. Going forward, however, the model might well be a better predictor, given that the recent “flatline” in ONS Reported Deaths is somewhat misleading; the immediately previous growth in Reported Deaths curve was slightly higher than in the Model Deaths curve.
Summary
We can see from the last three charts that very small changes in the mortality of variants can cause quite large changes in outcomes. All the data is there in the charts to show the input data, but the only difference in the datasets driving these three charts are in the Mortality data for Variants 1 and 2, the Wuhan and Alpha variants.
All of these model runs indicate that Covid-19 will have been mentioned on nearly 1/4 million UK death certificates (the UK definition of a Covid-19 related death) by March 24th 2024, after about 4 years of Covid-19.
The vaccine, since it was first offered in January 2021, has reduced the death rate considerably from what it might have been. I hesitate at this point to run the model without vaccines to demonstrate that, since that would be very far from reality, in terms of the scale of deaths, which as a theoretical exercise would be very misleading.
I know from my early work, when testing the vaccine model, from late 2020 through 2021, what a very big beneficial difference the vaccine makes to the outcomes in the model (and in real life, I am sure).
Conclusion
We not only see ONS Reported Deaths as flat now (i.e. no ONS daily Deaths updates since April 30th), but also that the “wave” decline in ONS Reported Cases has now become a monotonic and steep reduction.
If the ONS reporting of Active Cases were as complete as before, I think we should have continued to see the same wave behaviour (but with reducing amplitude) in the decline.
This suggests to me that the quantum of ONS Reported Active Cases does not reflect reality, but is probably a manifestation of a gradual and partial cessation of ONS Active Case reporting, maybe as a result of national, regional or local reporting differences in the UK. It might have been better to cease all reporting, not only for for Deaths, but also for Active Cases.
I think, therefore, it would be unwise to rely on any ONS reported numbers since mid-March 2023, not only for Deaths (which were clearly not being updated at all from April 30th) but also for Active Cases. I think reported data from that point is questionable: no data is better than bad data.

One thought on “My Coronavirus UK model outcomes as ONS reporting comes to an end”