
Modelling the NPI relief that a vaccine might allow, in a 3-variant context
Executive Summary
The work reported here supports a paper by Prof Alex de Visscher on more general structural changes to epidemiological modelling to cope with NPIs (Non-Pharmaceutical Interventions), new variants of SARS-Cov-2 and vaccine programmes. I focus on the application of model versions I have been working on in the UK context.
In September 2020, a new SARS-Cov-2 variant was detected in the UK, which has spread quickly to dominate the Covid epidemic in the UK, starting in the South-east of England and London, and spreading widely from there; I have added this to the model for the UK.
Since then, other “Variants of Concern” (VoCs) have been seen to pose a threat, particularly ones from South Africa and Brazil, so I have extended the model to cope with multiple variants, and this paper includes, as an exemplar, a third variant starting at the beginning of 2021.
I had already added a vaccine capability to the model, with a vaccine programme which can reflect inoculations at a daily rate that changes from time to time, with efficacy changes at those dates if required.
This paper reports some parametric runs I have made that compare, in particular, how the vaccine programme allows some NPI relaxations compared with a scenario with no vaccination.
The outcome is that the vaccine programme in the UK has the potential to reduce the imposition of NPIs on March 7th by about 15%, without costing lives, this date being the next time we in the UK are due for a major NPI review, potentially involving the return of schools on around March 7th.
Introduction
Alex had already, last summer, developed his original Covid-19 model to handle Non-Pharmaceutical Interventions (NPIs) through an overall adjustment, up and down, to the Intervention effectiveness %, at a succession of adjustment dates. I have made liberal use of this for the UK for some months.
Since then, Alex and I have both made additions to the model to handle multiple variants, as well as the introduction of a vaccine, on which I have recently reported in this blog https://brianrsutton.com. My blog has been reporting my Covid-19 modelling for the UK since March 2020 with over 35 blog posts, all based on variations of Alex’s model that both he and I have adjusted from time to time. A couple of my most recent blog posts, amongst others, concern multiple variant modelling on January 21st and vaccine modelling on November 25th. This short paper is in support of Alex’s next publication for the Springer journal Nonlinear Dynamics, where he has published before.
2nd variant timeline in the UK
My model covers three virus variants: the original one from early 2020; the second one whose timeline is shown here, starting on September 23rd 2020; and a putative third variant starting on January 1st 2021.

I have added a third variant on January 1st (and can add more as required) because a South African one has already been detected in the UK, and there are also fears about a Brazilian variant.
It may well be that none of the variants is unique, compared with mutations elsewhere, and using “national” names for them, as shorthand, is probably inappropriate, since Coronaviruses are mutating all the time (owing to DNA replication mistakes) and mutations that, for example, increase transmission rates, or confer advantages on a variant in other ways, are likely to survive longer. There is some evidence that similar specific mutations (and the current ones we are seeing have several such mutations all at once, with some in common) are carried by several of these “Variants of Concern” (VoCs).
Scenarios
My first scenario, UK182, is my base one with no postulated future NPIs. We have a lot to learn about any new variants; it is thought that variant 2 has a transmission rate up to 70% higher than the first variant in the UK, although conclusions about its mortality are as yet unclear. I have assumed the 70% increased transmission rate, and the same mortality as variant 1 so far, but this can be changed.
There are some additional variant cases in the UK at present, 77 cases, last time I heard a specific number, on January 25th at the Downing St briefing, for the South African one, but some UK postcodes (all over the UK) have are being offered “surge” testing to establish the true extent. These strains are identified through genomic testing.
I have initiated the third variant at double the transmission rate of the first, as a worst-case at the moment, with the same mortality as the first two variants. All of these settings may be changed.
Charts
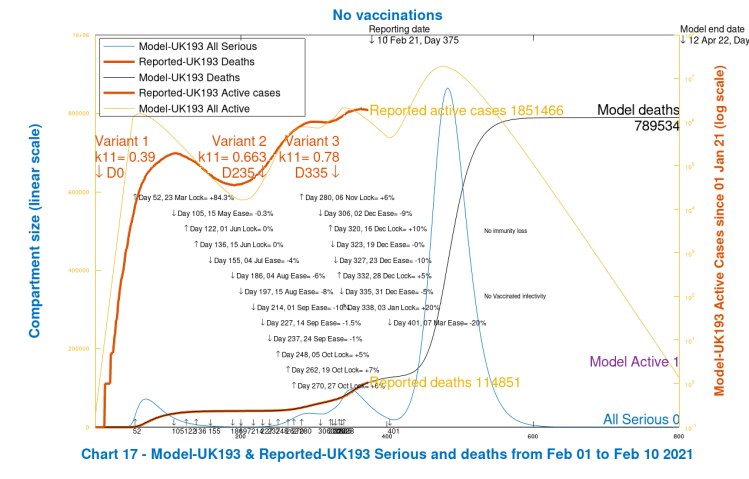
Chart 17 for each scenario shows modelled overall Serious cases and Active cases compared with UK public reporting, as summarised in tables and charts by the Worldometers site for the UK. My model picks up this data automatically from Worldometers, using Python code developed for me by Dr Tom Sutton, and is up to date to the day previous to the time the runs are made (February 10th and 11th 2021, respectively, for this writing).
Tom’s Python code also launches the simulation codes for the model, written in Octave/Matlab by Alex and modified by me; the appropriate country data from Worldometers is passed from the Python fetch code to the main routine which sets parameters such as the required simulation duration (800 days for these cases), NPI dates and effectiveness for the country (UK in this case), variant versions and vaccination rates and efficacies.
This main routine calls the epidemiological simulation with those parameters, a differential equation solver is called, results are passed back, and the charts plotted and saved.
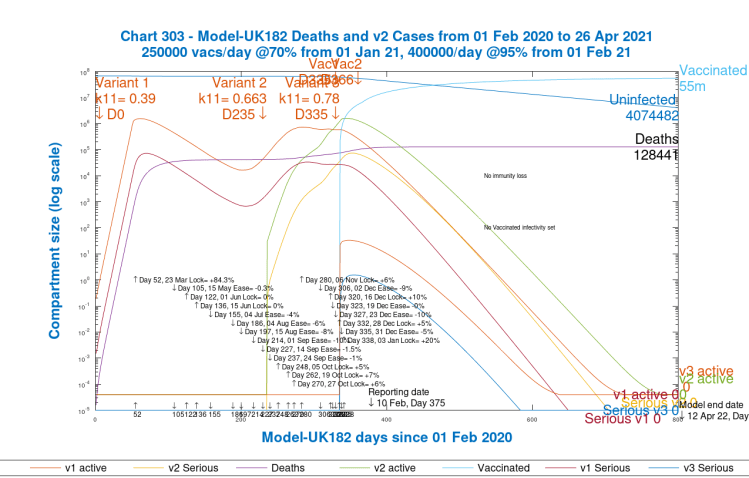
Each Chart 303 shows the Active cases and Serious cases separately and in more detail for each variant.
Vaccination
On both charts 17 and 303, for each scenario, we also see modelled Vaccination progress for the UK, starting on January 1st 2021. The very first vaccination was on December 8th, but it takes 3 weeks for first doses to take effect, and so January 1st is a reasonable starting date for the effect to be introduced in the model, at scale.
My modelled vaccination programme is in 2 phases for this paper: 250,000 inoculations per day from January 1st, at 70% efficacy, and then 400,000/day at 95% efficacy from February 1st and thereafter. These parameters can be changed easily; the rates currently reflect the UK’s target for 15m inoculations cumulatively by mid-February.
The UK has decided to delay second vaccinations to 12 weeks instead of 3 weeks after the first. Efficacy, in reality, is probably lower than my assumed 95% for doses after February 1st. The model starts vaccinations on January 1st, since the first UK vaccination was December 8th, and it takes full effect 3 weeks later. Opinions vary on the effect of the 12 week interval, with the WHO reportedly agreeing that efficacy might be greater with a longer interval than 3 weeks, as stated by an Oxford research study. Care is needed, as the vaccination candidates, for example, might be skewed on an age basis, as this BMJ coverage mentions.
Waning immunity?
My model has the capability to reflect “waning” immunity, but I have not set this parameter for this paper. While there is reasonable evidence that immunity to Covid-19 might average around 5 months, it is also the case that the UK Government is already discussing an autumn programme of refresher vaccinations (just as the influenza vaccine is administered every year).
The model assumes for the moment that immunity doesn’t wane, since such repeat dosing would keep immunity at higher levels.
Vaccinated infectivity
I have seen some discussion of not only the efficacy of the vaccine in protecting the recipient, but also of its effectiveness in preventing others from being infected by a vaccinated person carrying the virus (for example through shedding a (possibly reduced post-vaccination) viral load in the airways). This is somewhat uncertain at present, and so although I have added model code to reflect such a situation, it is non-operational in the model for this post, and is subject to change. It’s a potential upgrade.
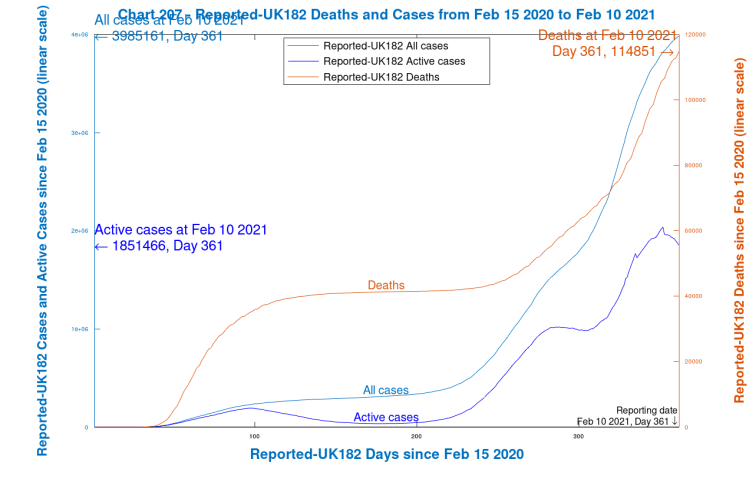
The UK reported data
First, I show my chart 207, which is purely for the UK reported data, up to 10th February 2021.
This data is published every day by the UK Government at the UK Covid information website. Worldometers (published by the University of Washington, Seattle) are always very quick to correct errors in the UK data, and I find sourcing from the Worldometers UK site to be more accurate on a timely basis than for any corrections to the U.K. Government website, which seems slower to react.
Worldometers state that by removing deaths and recoveries from total cases, they get “currently infected cases” or “active cases” (cases still awaiting an outcome). I haven’t plotted Recoveries in Chart 207, but both Total Cases and Active Cases are plotted against the left y-axis (shades of blue), and Deaths are plotted against the right y-axis (red). The x-axis is scaled in Days from February 15th 2020 (when Worldometers data begins, and before any reported Covid deaths in the UK), as are all the following charts
Scenarios
I present several scenarios highlighting the differences in outcomes between vaccination and no vaccination, and with and without possible NPI (Non-Pharmaceutical Intervention) reductions on March 7th 2021, stated by the UK Government as the earliest date for schools to re-open.
This first scenario, UK182, is reported now for later comparisons. I will show just two charts for each scenario; Chart 17 for overall Active Cases and Deaths comparisons with reported data; and Chart 303 to highlight individual variant contributions to Active cases and Serious cases.
Base Scenario 1: UK182, with vaccinations, no new NPIs and three variants
First I show my current base case for the UK, which I call UK182, starting with Chart 17, which compares the model outcomes with the reported data as shown in Chart 207 above, from the beginning of the pandemic to February 10th 2021, and goes on to show the 800-day outcome. Only NPIs already implemented are shown.
What we see most strikingly (as for all the following Chart 17s for other scenarios) is a very good fit of modelled deaths to reported deaths, to February 10th.
The Active cases (which are much more prone to reporting and timing errors, in all countries, just as Total cases are) show a reasonable match to the pattern of reported growth and decline from time to time, particularly after the first wave (when I believe reporting was less complete, timely and accurate than it is now). Arguably, epidemiological models can highlight such missing and inaccurate reported data.
The Serious cases show the expected (and observed) spike in late 2020 and early 2021, as we know from UK hospitalisations and ICU cases. Modelled Serious cases are not the same as either of these hospitalisation measures, but a suitable and consistent fraction of modelled Serious cases can be used to estimate hospital admissions and/or ICU occupancy.
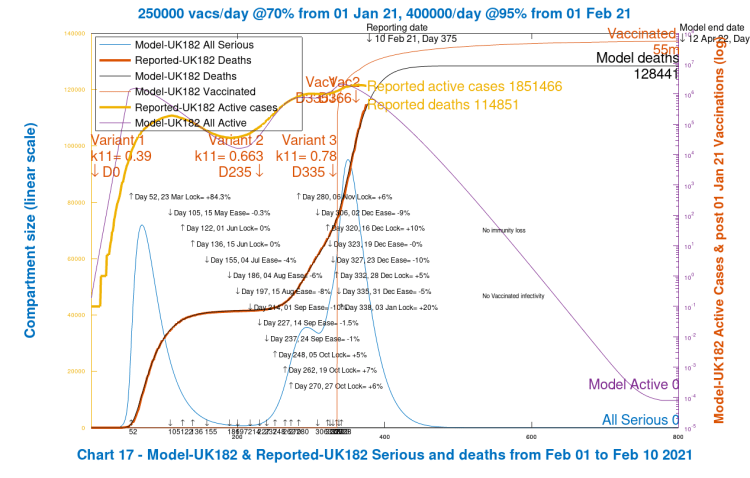
Chart 303 below shows the Active and Serious cases for each variant. Points to note there are that the third variant doesn’t get going in this scenario, because it has been “seeded”, or introduced to the model at a time when NPI effectiveness is already at 97.5% – i.e. the infection rates are just 2.5% of the natural infection rates for the variants owing to the high levels of social distancing, travel restrictions, hospitality business closures and all the rest of the measures taken in the UK on January 3rd, resulting in the UK’s third “lockdown”.
I have run other scenarios, for testing and other reporting purposes, when I introduced the third variant to the model earlier, just as Variant 2 was introduced on September 22nd to reflect its first swab detection on September 20th in the UK. Then the third variant does have a chance to establish itself in the model when NPIs are lower, but this isn’t a refection of the observed presence of a third UK variant at those earlier times. I ran those tests only as a check on the model performance. We will see more of the third variant, however, in some later scenarios in this paper.
In both charts 17 and 303 (and in all the scenarios that follow), note the dates and settings for the % effectiveness of the NPIs tabulated in the body of the chart. In this baseline scenario, the most recent NPI setting is the +20% enhancement on January 3rd to reflect the UK Government’s measures imposed at that time, after some (reluctantly reduced) relaxation over the festive holiday period, also reflected in those NPI % settings in the model as shown on the chart(s). In hindsight, those intended festive period relaxations came at precisely the wrong time in relation to the growth phase of the second variant.
Also note that by April 12th, 2022, 55 million vaccinations have been carried out in this model scenario.
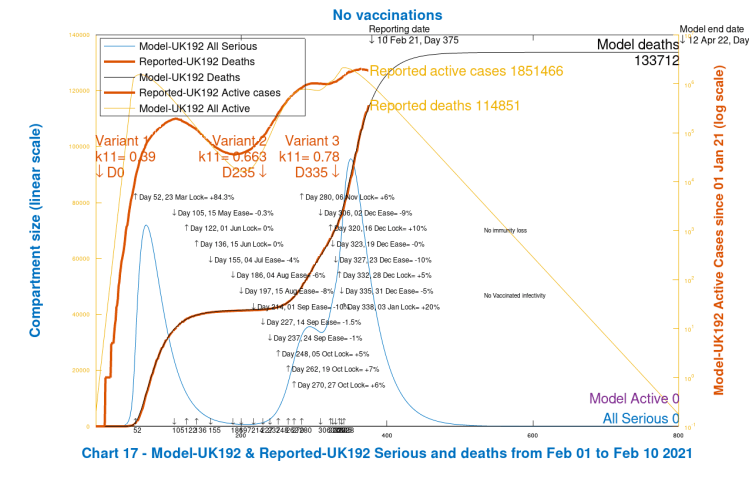
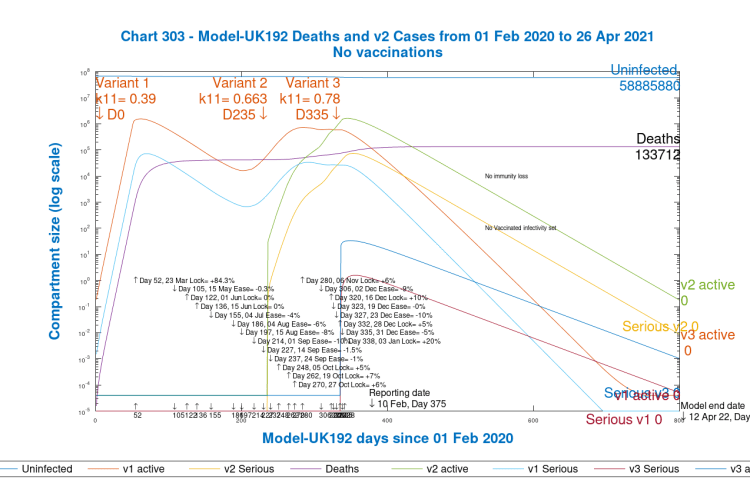
Scenario 2: UK192; no vaccinations and no March 7th NPI reduction
I now show the corresponding Charts 17 and 303 for the “No Vaccination” scenario, with no future changes to NPIs, as before, and with the same variants.
We see that modelled deaths, compared with Scenario 1, increase from 128,441 to 133,712, an increase of 5,271 deaths. This might seem a surprisingly low increase, but expectations of the effect of the vaccine on the epidemic in the short term have already been set low by most Governments, including in the UK, reflecting that we are already a long way down the epidemic track, and that NPIs have already made a significant downwards impact on the progress of the epidemic, and are still in place at a high level.
The second variant in the UK has become dominant since it started to be reported in public in December 2020, by which time it had already taken a major foothold since it was first detected in a swab on September 20th. We see from the charts 303 that the active cases for variant 2 peaked as high in the model as the original UK variant (although reported cases, as I have said, are prone to errors, omissions and timing differences, especially in the earlier days).
The vaccination effect, of course, will only show up during 2021, since vaccinations will have had a negligible impact in 2020, starting in the UK as they did on December 8th 2020, with a 3-week lag between inoculation and effect, no matter what the efficacy. Postulated variant 3 still has little effect, but we will see more in the next scenario.
Scenario 3: UK193; 20% NPI reduction on March 7th, no vaccine
The UK Government has already announced that schools will not return until March 8th at the earliest, to help fight the spread of the epidemic. At that time, one can assume that NPIs, in effect, would be eased, through schools returning, and through any other adjustments made at that time.
It’s the best indicator we have at the moment for the timing of further changes to the NPI regime going forward. This worst-case scenario, removal of all of the January 3rd lockdown 20% enhancement to restrictions on March 7th, would be for a minus 20% adjustment to the NPIs in the model (equivalent to removal of the whole lockdown intervention of January 3rd), and I show this first, in the context of no vaccinations, not as a realistic projection, but to help show what vaccines are doing for us, in later scenarios, by comparison.
We see a huge increase in modelled deaths (remembering that this is just a worst-case scenario to calibrate the effect of the vaccine in the next scenarios, and NOT a projection).
All Active cases peak at upwards of 10m in mid-2021 (against the log right y-axis), with Serious cases into the millions (against the linear left y-axis), and modelled Deaths (also left y-axis), at 800 days, at a cumulative level at 789,534.
These increases have their roots in the relaxation (ease) of NPIs on March 7th, Model Day 401, shown in the body of the chart along with all of the other NPI settings. This 20% reduction is far more than is sustainable (with no vaccine protection), given the upwards impact on cases and deaths, and of course is higher than the UK Government, advised partly by modellers doing this kinds of analysis, would entertain. Now I show Chart 303 for this scenario, which shows the related Variant contributions.
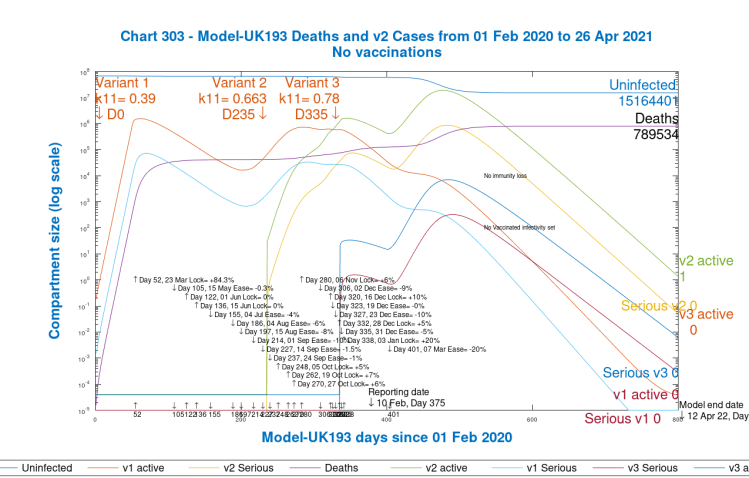
Here we see that the contribution of the first variant remains in decline in 2021, but the second variant, introduced on Day 235, September 22nd, just after it was first detected in the UK, has become dominant.
The postulated third variant, this time, has found the space and time to become established, on and beyond Day 401, when NPIs were reduced by 20% in this scenario, before reducing along with the other variants in the latter part of 2021, as part of their life-cycle, remembering that some NPIs are still in place (still at quite a high 77.5% level).
Variant 3’s effect, however, is relatively limited in the model, and so even though it doesn’t reflect a known, significant presence of such a South African or Brazilian variant, I will leave it in the model, for consistency, in the following scenarios, where I will apply the vaccine, and then adjust the March 7th NPI reductions to bring the model back to more realistic inputs/outputs.
Scenario 4: UK177; 20% NPI reduction, March 7th, with vaccine
This next Scenario, as for subsequent ones, restores the original vaccine programme. The 20% reduction in NPIs on March 7th is still in place from the previous Scenario 3. Note that we manage 54 million vaccinations by the end of the model simulation.
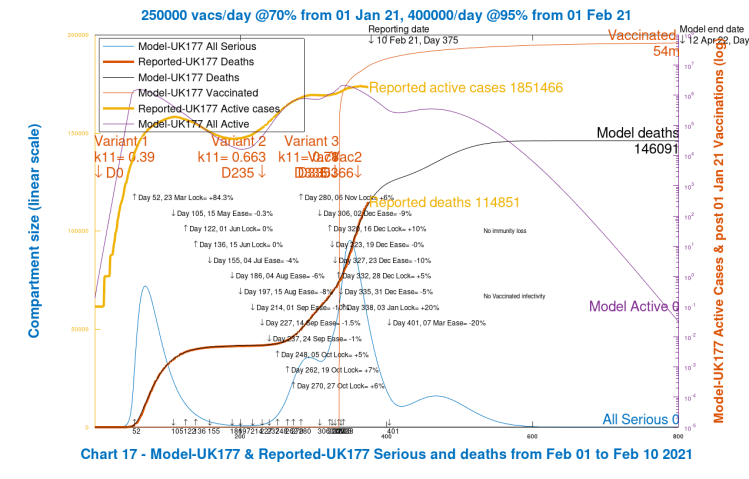
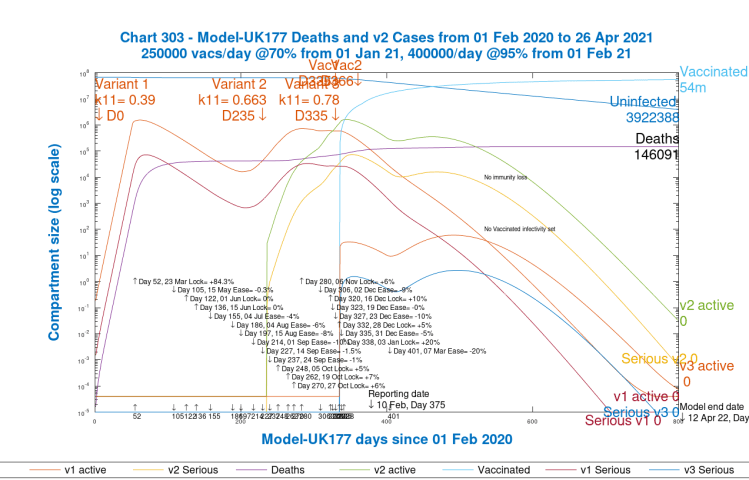
We have now returned to a less extreme situation, where, in particular, the second variant Active cases, the main driver for late 2020 and early 2021 UK infections and deaths, have reduced by a factor of 10. We do see a bump in Active cases and Serious cases, immediately following the March 7th relaxation, but the still high level of NPIs does control them, and the variant 3 Cases only get into the hundreds before they decline along with the dominant 2nd variant. The original variant had already reduced to very low levels.
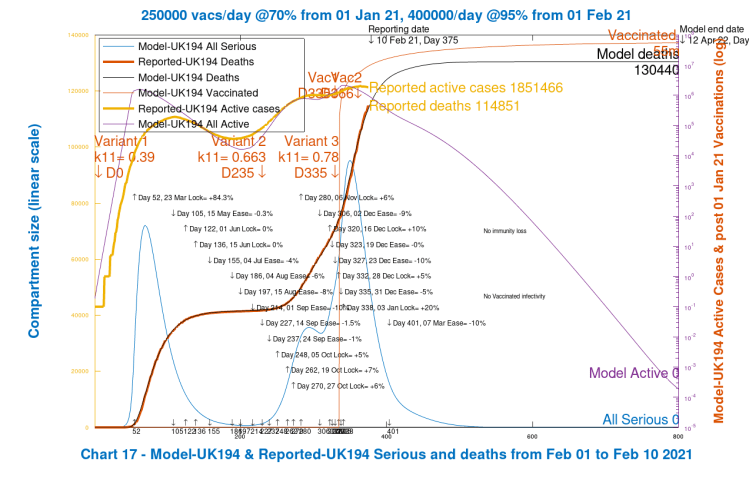
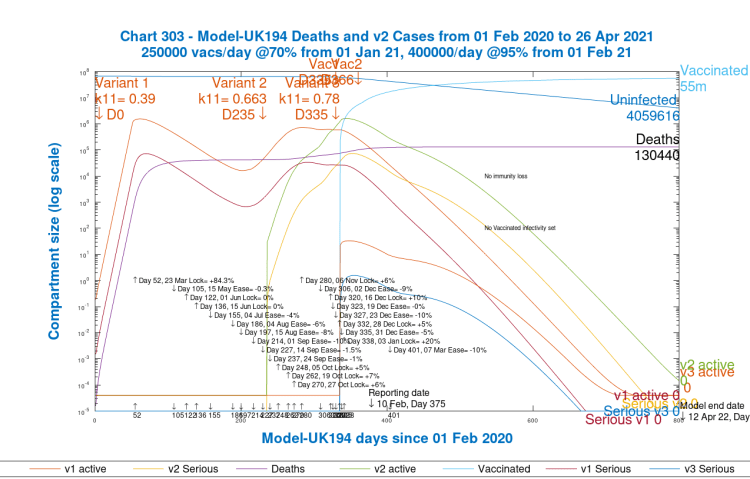
Scenario 5: UK194; 10% NPI reduction, March 7th; with the vaccine
I now return to a more realistic scenario, and reduce NPIs by only 10% on March 7th. We see a return to a level of cases and deaths somewhat above Scenario 1, UK182, with no NPI changes but also with the vaccine, and somewhat below Scenario 2, UK192, with no NPI changes and no vaccinations.
This level of 10% NPI reduction probably means not only schools returning, but possibly few other relaxations.
Compared with Scenario 2, UK192 for no vaccinations, the vaccine more than compensates for the 10% reduction in NPIs on March 7th in this scenario, with 130,440 deaths by day 800 in this scenario compared with 133,712 for Scenario 2.
Let us now look at a scenario that brings us much nearer to the Scenario UK192 deaths outcome, where we reduce NPIs a little further, by 15% on March 7th.
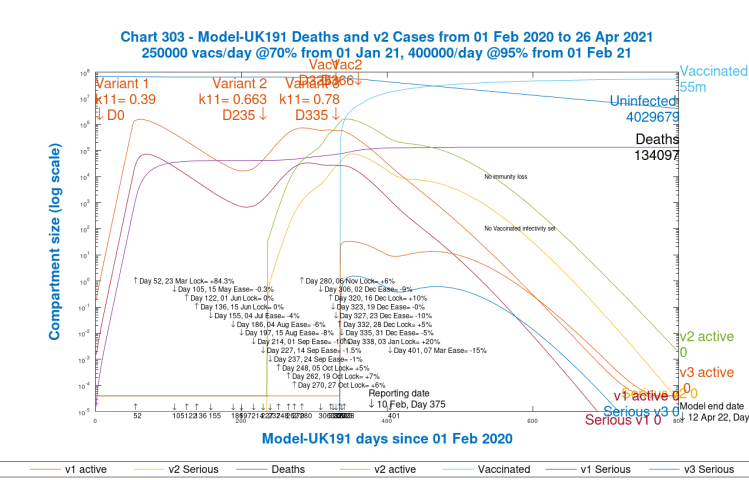
Scenario 6: UK194; 15% NPI reduction, March 7th, with vaccine
What we will see from the charts in this case is that the Day 800 modelled deaths (at 134,097) have been brought back to very near the level of deaths in Scenario UK192 (133,712) that had no vaccinations and no NPI reductions. The vaccination programme in this Scenario, as measured by the effect on the deaths rate, has almost compensated for the 15% reduction in NPIs on March 7th.
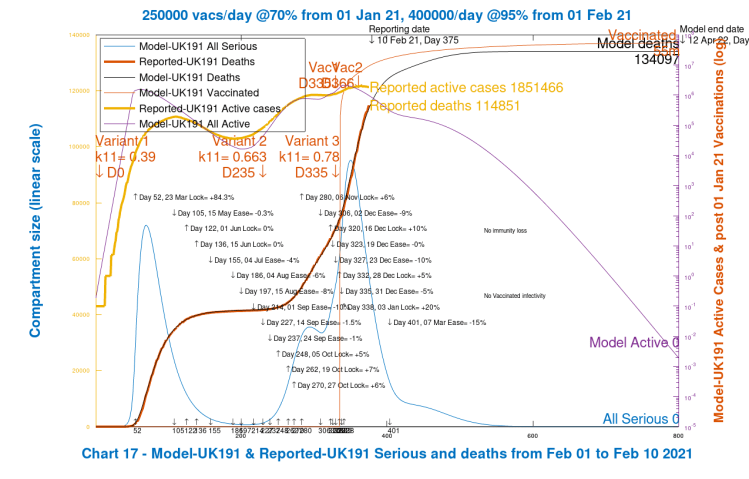
Chart 303 confirms this position. The third variant does not get started, and Variant 2 active cases are near to where they were originally.
Discussion
The last two model scenarios, UK194 and UK191, show that a vaccine, even in the relatively short time it has been effective since the start of 2021, allows a March 7th 15% reduction in NPIs without a negative effect on death rates compared with the model run without vaccinations or NPIs, UK192.
The cumulative level of NPIs at that March 7th date would still be more than comparable with the UK’s first lockdown: 97.5% – 15% = 82.5% after March 7th 2021 compared with 84.3% on March 23rd 2020.
Vaccination rates have been set at a realistic level in the model, totalling a little over 16 million by March 7th, a little below the UK Government target rate of 15 million by mid-February, but not significantly so. The mid-February model number is nearly 11 million.
Vaccination effectiveness in the model is set at 70% for the month of January, but at 95% from February 1st and thereafter, however, and vaccinations continue to run at 400,000 per day after February 1st (very close to the UK rate at present, which might or might not be sustained). Since 95% efficacy might well be a little optimistic, overall I think the model vaccination parameters are reasonable.
It is yet to be seen what level of efficacy of protection will be delivered by the single doses in the UK, during 12 weeks before second doses are administered. Some second doses have been adminstered, but only at about a 10% level at most.
The WHO think that 12 weeks gap is efficacious, as well as enabling more first vaccinations to be given in a given time, allowing more of those in vulnerable segments of the population to be treated as a priority should there be any limitations on supply and delivery capacity.
It might useful to run some sensitivities on the UK191 scenario in another blog post, with vaccination rates enhanced more quickly, and efficacy reduced, in the first 3 months, to understand any variation in the modelled vaccine effect. At the same time I might have enough data to consider waning immunity and any infectiousness of those who have been vaccinated.
Concluding remarks
The model scenarios I have run indicate that the vaccine programme in the UK has the potential to allow the reduction of NPIs on March 7th by about 15%, without costing lives.
March 7th is the next time we in the UK are due for a major NPI review, potentially involving the return of schools at around March 7th. This would be followed fairly soon by Easter, another point at which Government might think of making changes.
NPI measures taken during the latter part of 2020 were more targeted than previously, with a regionalised and tiered approach; results were mixed, leading the Government to consider different methods next time. Public response is also less disciplined, I would say, which suggests more legal backup to planned measures, including international travel restrictions.
UK Government might, of course, go further than this 15% level of lockdown easing, looking at several areas of negative impacts of severe NPIs, including, but not limited to: the economy; children’s and young people’s education, including at University level; people’s social engagement and quality of life; the delivery of other health services, such as early diagnosis of dread diseases; and mental health and mental health counselling.
Decisions might be taken that have the effect of an increase in Covid deaths, while saving lives and livelihoods in other ways, either now or in the future.
As Prof Chris Whitty, the UK Chief Medical Officer (CMO), and Sir Patrick Vallance, UK Chief Scientific Adviser (CSA) often say, these are political decisions, not strictly medical or epidemiological ones, and not for them – and certainly not for me, thankfully.

4 thoughts on “NPIs, Coronavirus variants and vaccine models”