
Introduction
In my December 23rd post, exploring the impact of a second variant virus, I made the simplifying assumption that given the second variant had achieved such high prevalence in the short time since it was detected, I would model it by replacing the original SARS-Cov-2 virus with VOC 202012/01 in the model on December 16th, when it was already responsible for 40% of infections in London.
In my concluding comments of that post, I promised to develop a further approach to allow concurrent virus strains (a more realistic approach), and indeed it does make a difference (a reduction) to projected outcomes.
I present these in this post, along with some sensitivities to Non Pharmaceutical Interventions (NPIs), but always with the background of vaccine dispensing, which started in the UK on December 8th.
Vaccination background
I set the initial impact of the vaccine on the virus in my model to be on January 1st 2021, because second doses would normally have started three weeks after the first dose, with full immunity conferred a week after that (when the vaccine is efficacious). I increase the rate of delivery from 100k doses per day on January 1st, to 200k/day on February 1st, and then 300k/day on March 17th.
These rates can easily be changed in the model, and more rate change dates added; at present in the UK about 1m first doses have been delivered, and the Oxford/AZ vaccine starts today, January 4th, as I write this post.
There are some uncertainties around delivery of the vaccine product, and the rates of inoculation through hospitals, GP surgeries and elsewhere, but I am happy that my rates are a reasonable estimate at present.
As for vaccine efficacy, that can also be adapted in the model (for each rate change date), and hitherto I have used the 95% figure for the Pfizer/BioNTech vaccine.
There is some debate about the efficacy of the Oxford/AZ vaccine (even though approved for use) and about when the second doses might be dispensed; instead of the 3 weeks originally outlined (and tested at 90% efficacy), the UK Government, on the advice of the JCVI, is planning to delay second doses for up to 12 weeks, in favour of giving more people their first dose (with estimated 70% efficacy).
This can be modelled, but for now I will leave the efficacy at 95% (as per the Pfizer vaccine whose first doses have already been delivered); as mixing vaccines is not recommended, it is possible that many that have had the first dose of the Pfizer vaccine might get their second dose as planned, with that vaccine, as GPs are reluctant to spend hundreds of hours contacting older people, who have had their first doses on that understanding, to delay those second appointments already made.
Sequential or concurrent 2nd variant?
I have adjusted my model’s compartment structure to show the effect of the 2nd virus variant acting concurrently with the original SARS2-Cov-2 variant, not acting sequentially, replacing the first variant. I present the structure of this model adjustment, and its results, in this post.
Counter-intuitively (until I thought about it) this brings the death rate down compared with my previous sequential version. Why?
In the sequential version, the Incubating, Sick and Seriously Sick (& Better) compartments in my model (which, rightly, can infect the Susceptibles in the model, the Uninfected individuals), are already populated by people infected by the first variant.
When the second variant is introduced and replaces the original variant, it starts to act with its new, higher infection rate on Susceptibles, with those compartments already populated at quite a high level by the original virus.
In the concurrent version, the original virus continues to infect Susceptible people, from the original I, S, SS and B compartments, while the new variant, with four NEW compartments of its own carrying the infection – Incubating (I2), Sick (S2), Seriously Sick (SS2) and Better (B2), dedicated to that new virus variant – has to build its own infected population from scratch.
This reduces its effect, compared with the sequential case, until it can build its own “customer” base. This will be seen in the following charts.
It highlights how running such a model CAN produce counter-intuitive results (although I should have thought of it first!), and how it helps understanding and calibration of the problem.
Model compartment (state) structures
The original version of my model was written by Prof Alex de Visscher of Concordia University, Montreal, and it is first described in his academic paper (with code) in March 2020.
We independently concluded that an NPI module was needed, and Alex added this in August, detailed in his subsequent publication.
Since then, I have added other functionality, including the cyclic version of the model, reported in my October 29th blog post using the UK and the USA as exemplars (with NPI interventions automatically triggered by the number of Seriously Sick individuals); the vaccine module I mentioned above, in my November 18th blog post; and latterly the the first version of my second variant module, reported in my December 23rd blog post.
Original model compartment structure
The generic SIR (Susceptible -> Infected -> Recovered) model has served for decades as the framework for the modelling of infectious diseases by many practitioners, and I described the formalism, in my April 8th post when also explaining the R0 indicator for disease infectivity.
Other compartment structures, including SEIR (Susceptible -> Exposed -> Infected -> Recovered) and SIS (Susceptible -> Infected -> Susceptible) are in frequent and current use to model diseases.
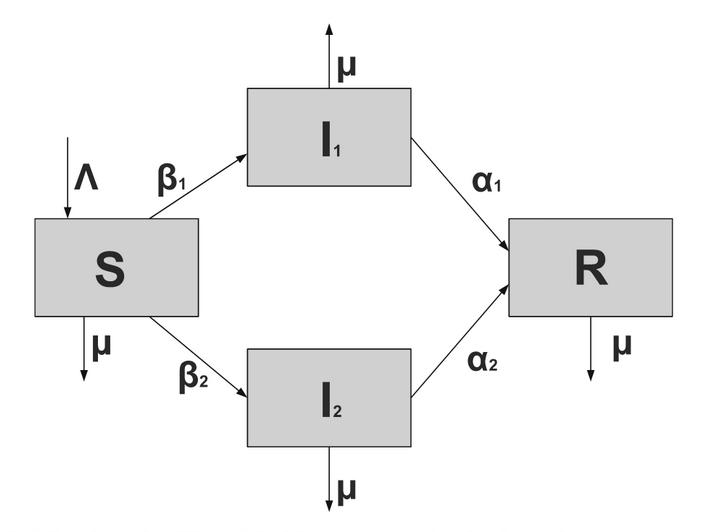
The 7-compartment base model structure, in contrast with such SIR, SEIR, SIS and other model structures, appears below, as per Alex’s original paper.

This is the model I was using from April to mid-October, having explored the Gillespie SIR model beforehand, as reported in my April 2nd post, which, in the version adapted for me by Dr Tom Sutton and Tomasz Knapik, used Monte-Carlo methods, and a spatial parameter (amongst others) which could be run via a browser with its parameter choices. I propose to use it a little more at some point, as geographical (spatial) differences in epidemic growth rates across the UK (and in other countries) become quite pronounced.
Model structure with vaccination
To cope with vaccination, and guided to some extent by Maia Martcheva‘s book, “An Introduction to Mathematical Epidemiology‘, in particular Chapter 9 215pp, I added a vaccination module, as I reported on November 25th. For this I added a Vaccination compartment, and the model structure then looked like this, with the new compartment V and its transitions labelled in red.

This wasn’t such a radical step, although I followed up my original November 18th post on vaccination with a further, modified one on November 25th). The changes I made were to correct and enhance the handling of sequential vaccination steps at different efficacies and dispensing rates.
Model structures for a second variant
My December 23rd post was my first look at the effect of a second variant of the SARS-Cov-2 virus (designated VOC 202012/01), assuming for simplicity a sequential replacement of the first virus with a second one (and potentially others) at a later date, with different (70% greater in this case) infectivity or transmission rate. This diagram from the Maia Martcheva Chapter 9 215pp and associated mathematical derivation helped this thinking.
This replacement assumption was clearly simplistic, and by December 16th, when I introduced the 2nd variant to the model, 40% of London infections were thought to be from the new variant, growing rapidly to 60%, a proportion which was thought to be (and was) growing fast. It did seem that the new virus variant was supplanting the previous one.
I was encouraged that this might not be so unreasonable, because Prof Martcheva had outlined (p183 pp) the “Competitive Exclusion Principle” that for many multiple virus strain scenarios, a strain with higher R0 value (in this case 70% higher) will supersede those with lower R0, as a result of competition between them to infect susceptible individuals. I was also able to develop that version of the model quite quickly.
London School of Hygiene & Tropical Medicine (LSHTP) version flowchart
I also noted that the modelling and Government advisory group at the London School of Hygiene and Tropical Medicine had, that same day, December 23rd, published their paper Estimated transmissibility and severity of novel SARS-CoV-2 Variant of Concern 202012/01 in England, the lead author being Nicholas Davies, and one of many other authors being Adam Kucharski, whom I have referenced (very positively) a number of times in my blog posts on related Covid-19 topics.
The LSHTP corresponding model flow diagram is as follows.
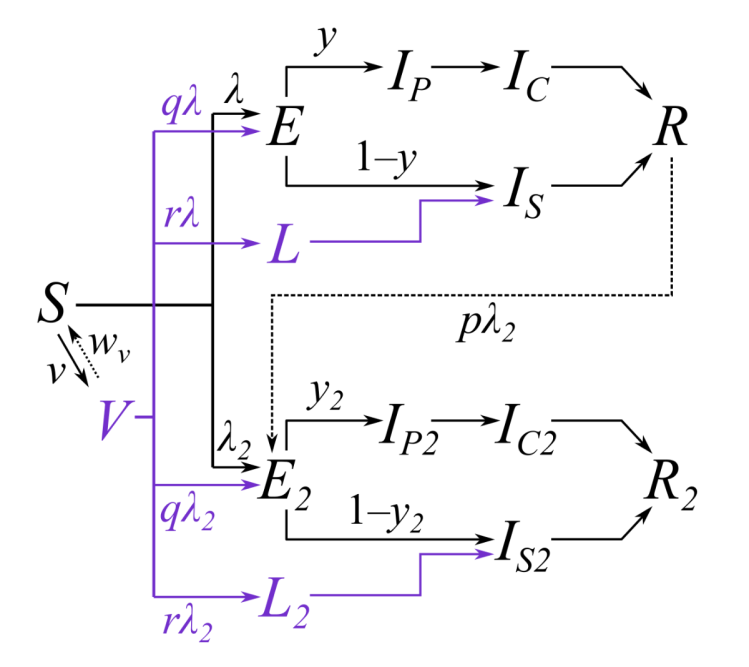
I add their own description of this quite complicated flowchart:
“Subscripts for age group and region are omitted from this diagram and only certain key parameters are shown. Compartments and processes in purple apply to the vaccine model only. S, susceptible; E, exposed-clinically infectious; R, recovered; V, vaccinated. Subscript 2 represents compartments and parameters for VOC 202012/01. Above, 𝜆 and 𝜆2 are the force of infection for pre-existing variants versus VOC 202012/01; y and y2 are the fraction of cases that develop clinical symptoms for pre-existing variants versus VOC 202012/01; 𝜈 is the rate of vaccination; 𝜔𝜈 is the waning rate of vaccination (assumed to be zero for this manuscript); p captures cross-protection against VOC 202012/01 conferred by immunity to pre-existing variants; q captures vaccine protection against disease; and r captures vaccine protection against infection. L and L2 are additional compartments for a latent period prior to sub-clinical infection only (i.e. with zero probability of clinical infection). For a vaccine with efficacy against disease 𝜀d (e.g. 𝜀d = 0.95 for this manuscript) and efficacy against infection 𝜀i (e.g. 𝜀i = 0.6 for this manuscript), we assume r = (1 – 𝜀i) * 𝜀d and q = (1 – 𝜀i) *(1 – 𝜀d).”
VOC here stands for Variant of Concern.
LSHTP have updated their December 23rd paper on December 31st, and it is under peer review. I was already working on my 2-variant model revision over Xmas and New Year, and this follows.
My model structure for the second variant
I haven’t applied as many parameters to my model, noting, for example, that LSHTP have different rates for vaccine protection against infection (typically 95% say) as distinct from infectivity (60% in their model), the difference between self-protection from a vaccine vs. protection against disease transmission to others.
There is always more to do, and in particular the age dependencies and localisation of the spread of the disease might also be modelled (as LSHTP do).
Localised “superspreading” was an early manifestation of asymptomatic carriers infecting others in what became infection hotspots in Italy and elsewhere. This mode of transmission has led to many local Government interventions in the UK since then, and now the second variant does seem to have developed very quickly in London and other parts of the south-east of the UK.
As far as the second strain aspects are concerned, my model, too, starts to look more complicated, with the addition of four more compartments and their associated transition rates.

All the rates of transition from one state (compartment) to another (people per day) behave similarly, in this new context, to the corresponding originals. The original compartments I, S, SS and B are repeated for the second variant as I2, S2, SS2 and B2.
The r10 rates, in my opinion, aren’t strictly needed, but Martcheva includes something of the sort, so I add a rate for Vaccinated people technically becoming Recovered. In fact, if it were the case that vaccinated folks were infective at some % fraction beyond the fraction I have already allowed, for those that get the doses that are ineffective (represented in my rates r9(1) and r9(2)), I should have to move/re-quantify those links elsewhere. But that needs more thought, and, if needed, execution time.
Finally (before I show some model scenarios and charts), my next step in model development would be to index the relevant compartments and all their flow rates, as I did for r1(1) & r1(2), r9(1) & r9(2) and r10(1) & r10(2), which means indexing the relevant differential equations.
At present, creating the second variant capability by “hard-wiring” the extra variables in the differential equation solver helps me think about any indexed version to cope with further variants, so this has at least been a helpful intermediate step.
I wrote an article describe those mathematical differential equations based on Maia Martcheva’s book which I will redevelop in indexed form as a basis for model flowchart enhancement.
My model chart outputs are useful in calibrating the effect of the new flow structure between compartments (states) so I will persevere with this a little longer, at least until the South African variant, 501v2 / UK VOC122020/02, lineage B1.351 or 501Y.V2, or another, becomes pervasive too, when I might need to introduce a third variant in the model. I included this possible eventuality in the Concluding Thoughts of my December 23rd post.
Model scenarios for the UK situation
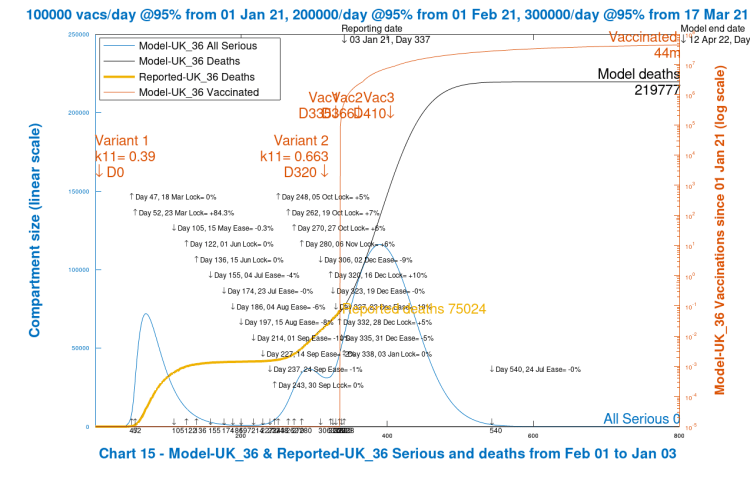
I will first of all show the case that is currently the most likely in the model, given the fit to reported data so far, and following the UK Government’s announced intentions for England regarding New Year NPIs (and parallel announcements in the other UK home countries, Scotland, Wales and Northern Ireland) with an aggregate NPI effectiveness of 88%.
Hence the transmission rate of variant v1 at the outset (0.39 people per day) has been reduced to as low as 12% of its initial value. This cumulative NPI effectiveness setting at any stage would also apply to the transmission rate of any new variant, 0.663 (70% higher) in the case of the second variant, v2, added to the model on Day 320, December 16th.
In this version of the input settings, therefore, the New Year enhancement of the NPIs of 20% is included within the aggregate 88%; this aggregate includes all of the cumulative increases and easings since the initial lockdown on March 23rd, as can be seen from the intervention dates and settings tabulated in the body of all of the charts.
Here is that first chart 15, similar to the Chart 14 that I used extensively in my December 23rd post for the various scenarios illustrated there, but with the Seriously Sick curve (light blue) including the total for both variants.
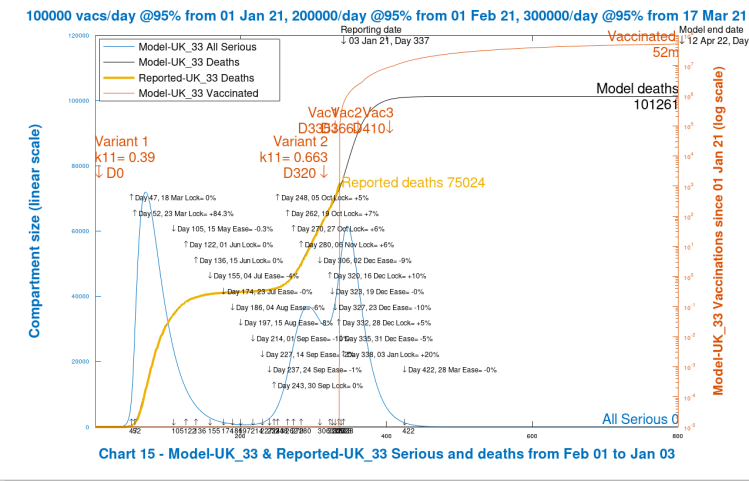
Note that 52 million vaccinations have been carried out by 12th April 2022 (model day 800); Seriously Sick (the sum for both variants) peak at 60,000 in early-mid January, not quite as high as the peak of 70,000 (for variant v1 only) in March 2020; modelled deaths are a good fit to reported deaths up to January 3rd 2021; and cumulative deaths reach 101,261, mostly by early summer 2021.
From the next two charts, we see that the spike in January Seriously Sick cases in Chart 15 above is caused by the addition of the modelled second variant. The next Chart 202 shows the Active cases separately for both variants, and the Serious cases for variant v2.

The steep ramp-up in 2nd variant Seriously Sick (SS) cases from December 16th just about doubles the original variant v1 number of SS cases of 30,000 to 60,000, and similarly, the Active cases for both variants are about the same at nearly a million each (in the model) at the peak at around the turn of the year.
The 20% increase in NPIs in the New Year (January 3rd) then starts to take effect, and the case rates drop, but not before deaths have also begun to increase (lagging infections by up to a few weeks), showing the 800 day out-turn at about 101,261 deaths, which have mostly occurred before the summer of 2021.
Single variant comparison
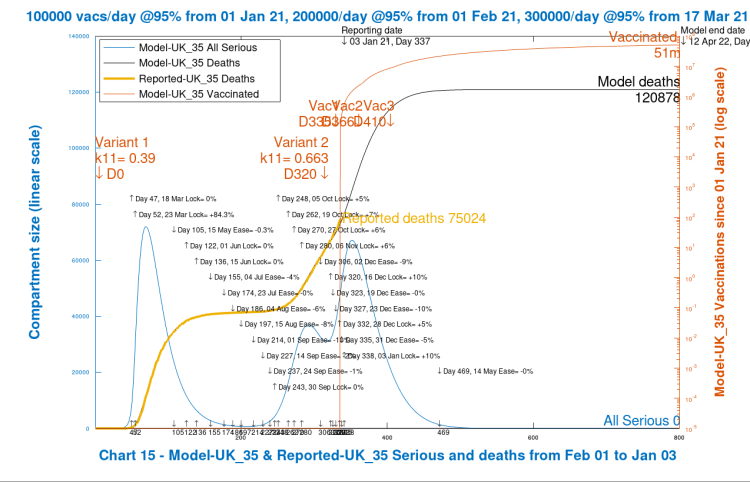
In the next chart 15, I show the outcome with the same interventions, but with no second variant present in the model.

Here we see no spike in modelled Seriously Sick (SS) individuals in January (the SS curve is fairly flat through December and the Festive/New Year period), and the deaths outcome is reduced to 85,231. But we also see that the modelled deaths had already begun to undershoot the reported deaths (the heavy orange curve) in the lead-up to the Festive period, and the easings during that period exacerbate that departure.
In summary, Chart 15 above indicates that the continuation of the single, original virus in the model leads to results that are contrary to what we have experienced during December and New Year. Adding to this, here is Chart 202 with the equivalent variant v1 active cases curve (with v2 active cases (green line) at zero for the whole simulation period, of course, in the absence of a second variant).

Reducing New Year NPIs in the two variant situation
I now show a couple of scenarios to indicate the sensitivity of outcomes to the New Year NPIs. The first reduces the NPI enhancement from 20% to 10% on 3rd January. This brings it down to an aggregate since March 23rd 2021 of 78%. Recall, for comparison, that the original setting was 84.3% at the start of the first lockdown on March 23rd 2020 (Day 52), as shown in the tabulations in the body of the chart.
Immediately we see that modelled deaths have increased by nearly 20,000 over my original “likely” scenario, with an increased peak in Seriously Sick (SS) people to a level approaching the March 2020 level, approaching 70,000.
Zero enhancement of New year NPIs
Pursuing this sensitivity analysis a little further, I now show the modelled scenario for no enhancement in New Year NPIs, a reduction of a further 10%, with the aggregate NPI effectiveness setting becoming 68%, far lower than during the first (and November) lockdowns.
Now we see that a disastrous modelled situation arises, with a large peak of around 120,000 in people becoming Seriously Sick around Day 400 (March 7th 2021), and nearly a doubling in deaths, most of which occur before the summer of 2021. The persistence in the Seriously Sick numbers can be seen in the relevant Chart 102, with a much slower decline than in the previous charts 202.

There are several things to note in this extreme scenario, apart from the upwards impact on deaths. The Seriously Sick curve for v2 infections is much slower to decline, and also the number of vaccinations by Day 800 has dropped from 53 million to 44 million, as the modelling assumes that only uninfected people are vaccinated. The Uninfected residual number at Day 800 has reduced (by about 2 million) from the original case, and had remained much lower through the modelled period.
Final scenario with 25% New Year NPI enhancement
As we have just seen, the UK Government today announced a return to something much closer to full lockdown, and I now run the scenario with 25% enhancement of NPIs from January 3rd.
This represents a cumulative reduction in the virus transmission rates of 93%, which is 9% higher than my March 2020 initial lockdown simulation. But following the relaxations of the Festive and New year period, and some less than complete compliance with the guidelines issued for that period, this scenario represents some catch-up in reducing social interactions to stem not only the original virus spread, but more importantly the spread of the second variant. It is currently and increasingly the dominant strain in many (and densely populated) areas. Here is Chart 15 for this scenario.

Now we see that the situation is much more controlled. The modelled deaths to date are in line with the reported deaths, but with the extra NPIs in the New year, the peak of the Seriously Sick curve is back to the Festive/New Year level (extra NPIs in the 2021 New Year don’t reduce that end of 2020 number) and they fall much faster subsequently. The modelled deaths at Day 800 are lower than in any of the other scenarios. To confirm the detail, here is Chart 202.

Vaccinations are back up to 52 million, and Uninfected numbers are around 40,000 above where they were in the first scenario.
University of Washington comparison to April 1st 2021
As in recent posts, I compare my more likely projection with the current UK forecast from the University of Washington (based on Worldometers data for the UK as my reported figures are) to April 1st 2021. First my April 1st Day 425 projection.

As I mentioned before, nearly all of the projected UK modelled deaths occur in the earlier part of 2021. Note that the number of vaccinations is at 13 million, fairly close to the UK Government’s target (15m) for vaccinations (although just for the first doses, mainly) in the first quarter of the year.
The equivalent University of Washington projection follows.
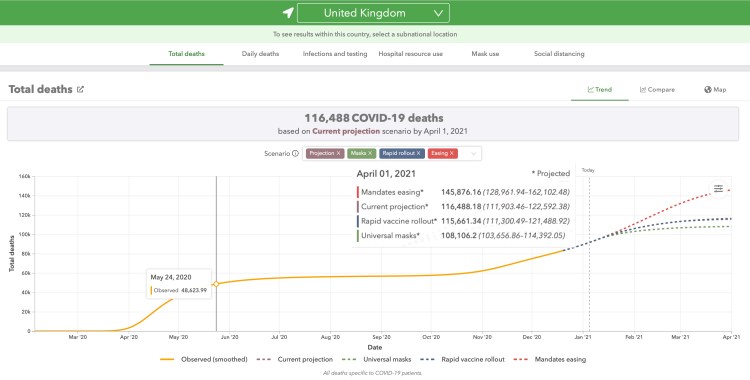
This looks somewhat more pessimistic, although the “mandates easing” option is very unlikely (especially with the latest lockdown announcements in the UK home countries).
The briefing notes for the University of Washington UK forecasts show the basis for the projections; some assumptions are a little different from mine, for example with vaccination rates and efficacy. The latest UK interventions will be absent too.
Finally, for completeness, my Chart 202 with the active cases from variants v1 and v2.

We see the active cases for variant v2 are at 16,640 against 10,857 for variant v1 at April 1st, even after a fairly short period since December 16th when variant v2 was introduced to the model.
The peak for both variants in this new phase of the epidemic is just about at the turn of the year, at about a million active cases for both. That includes all active infections in compartments I, S, SS and B for both variants; it excludes Uninfected, Deceased and Recovered individuals.
All Seriously Sick (from Chart 15) stand at 1,280 on April 1st, and from Chart 202 we see that variant v2 is responsible for 790 of them at that point, well over half.
Discussion
This is probably about the best we could sensibly do with other model settings as they are. It might be that the assumption of 70% higher transmission rate for the second variant is a little too high, or its starting date too late, or that other measures, such as the vaccination rate, can be improved to control the virus further by increasing population immunity.
It is fairly clear that the January measures that all home UK countries are taking are necessary, but the good news is that this time through the lockdown situation, we have the vaccine roll-out to help us.
What is very important is that people take the vaccine for this to be the case, a point I have made repeatedly before. In this situation, the antivaxxer message, if given any credibility, is a danger to everyone .
Concluding thoughts
As I indicated earlier, there is much more that can be done to help the precision of models such as this, although some of those enhancements require much more detail and aggregation of larger datasets reflecting social, work and travel patterns and mixing, and more refined data about the variants of the virus and their behaviour (and that of possible successors).
I will continue to track the reported data; the vaccination delivery performance in terms of rate of dispensing and likely efficacies (as there are several vaccines in play); and Government interventions and population responses.
I shall also seek to make further model adjustments to improve accuracy and reliability of projections.

One thought on “Concurrent Coronavirus two variant modelling”