I reflect on my past experiences with event-based simulation, connecting it to Queuing Theory and the statistical mathematics used in telephone exchanges and modern technological applications, particularly gaming platforms like Zwift. I draw parallels between call arrival patterns and infection models, particularly regarding COVID-19. I acknowledge the influence of historical research, including work by Prof. Neil Ferguson, on understanding infection dynamics and the necessity for public health measures like social distancing. I emphasize the importance of mathematical modeling in managing infectious diseases effectively.
Category Archives: Imperial College
Reflecting on the UK’s First Coronavirus Lockdown: Five Years Later

This article presents two case number comparison charts for the 9th March and 23rd March 2020 UK Coronavirus lockdown dates. I had covered the deaths data in more detail in my previous post on this topic, and add that here too.
A first 2022 Omicron update – Coronavirus

While it is still very early days, both in the New Year of 2022 and also for the Omicron variant, this post adds to my recent 19th December update with a summary of further runs of my model for higher transmissions settings. Last time I ran options up to three times the transmission rate of the Delta variant, and I have now looked at transmission up to five times the Delta rate.
The Coronavirus pandemic situation in Europe
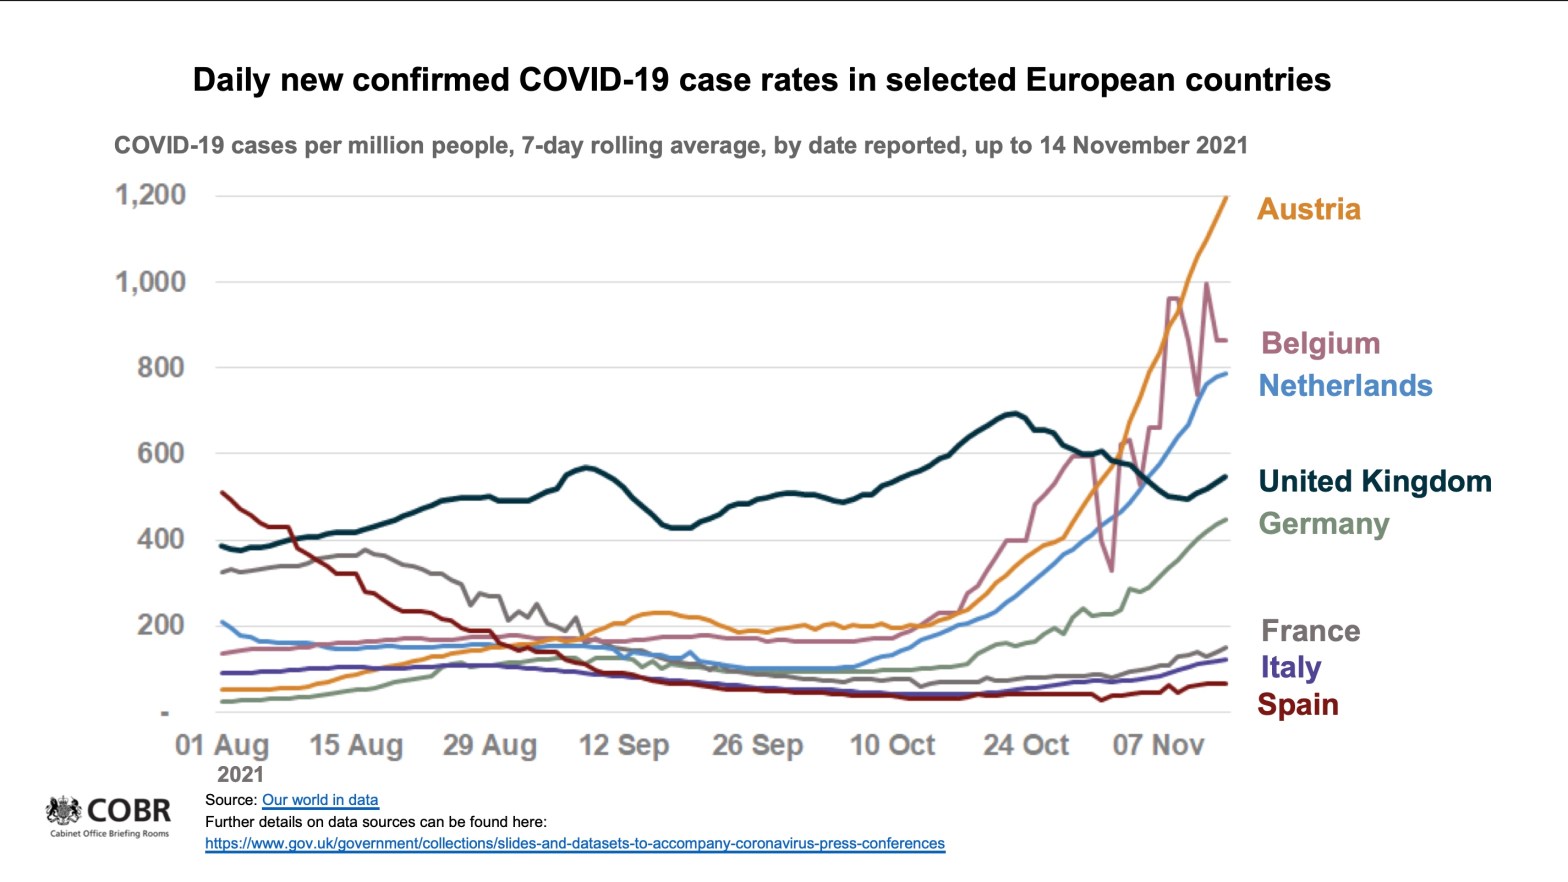
The pandemic situation in continental Europe has been worsening rapidly, and I felt that it I should update some country comparisons in a dedicated post.It confirms that the sourcing of data for a Coronavirus model of any given country is a very specific task nowadays, given the considerable differences in the underlying demographics, cultures, Government actions (NPIs) and public responses in the various countries.
This blog post isn’t looking at the modelling per se, but concentrates on the very different outcomes we are seeing across Europe, and looking at some of the reasons why.
Adaptive triggering and the Coronavirus epidemic life-cycle

Introduction In my last post on October 21st, looking at the potential for an exit from the epidemic, I described a cyclical version of the modelling of the epidemic in the UK, reflecting outputs from Imperial College and Harvard earlier this year, which postulated a continuing cycle of partial lockdowns, easing of restrictions and upsurgesContinue reading “Adaptive triggering and the Coronavirus epidemic life-cycle”
Where’s the exit? – Coronavirus

My title for this post is drawn from a slide I have shown before, from the 17th April Cambridge Conversation webinar, which I reported in my April 17th blog post, and also in my April 22nd blog post on model refinement, illustrating the cyclical behavior of the Covid-19 epidemic in the absence of pharmaceutical interventions, with control of cases and deaths achieved, only to some extent, by Non-Pharmaceutical Interventions (NPIs).
Recent events and Coronavirus model update

Many countries, including the UK, are experiencing a resurgence of Covid-19 cases recently, although, thankfully, with a much lower death rate. I have run several iterations of my model in the meantime, introducing several lockdown adjustment points, since my last blog post, as the situation has developed. The key feature is the sharp rise cases, and to a lesser extent, deaths, around the time of the lockdown easing in the summer. I have applied a 10% increase in current intervention effectiveness on October 19th (although there are some differences in the half-term dates across the UK), followed by a partial relaxation after 2 weeks, -5%, reducing the circuit-breaker measure by half – so not back to the level we are at currently. The effect of that change is shown in the final chart in the blog post.
Phenomenology & Coronavirus – modelling and curve-fitting

There is a range of modelling methods, successively requiring more detailed data, from phenomenological (statistical and curve-fitting) methods, to those which seek increasingly to represent the mechanisms (hence “mechanistic” modelling) by which the virus might spread.
We see the difference between curve-fitting and the successively more complex models that build a model from assumed underlying interactions, and causations of infection spread, between parts of the population.
Some thoughts on the current UK Coronavirus position
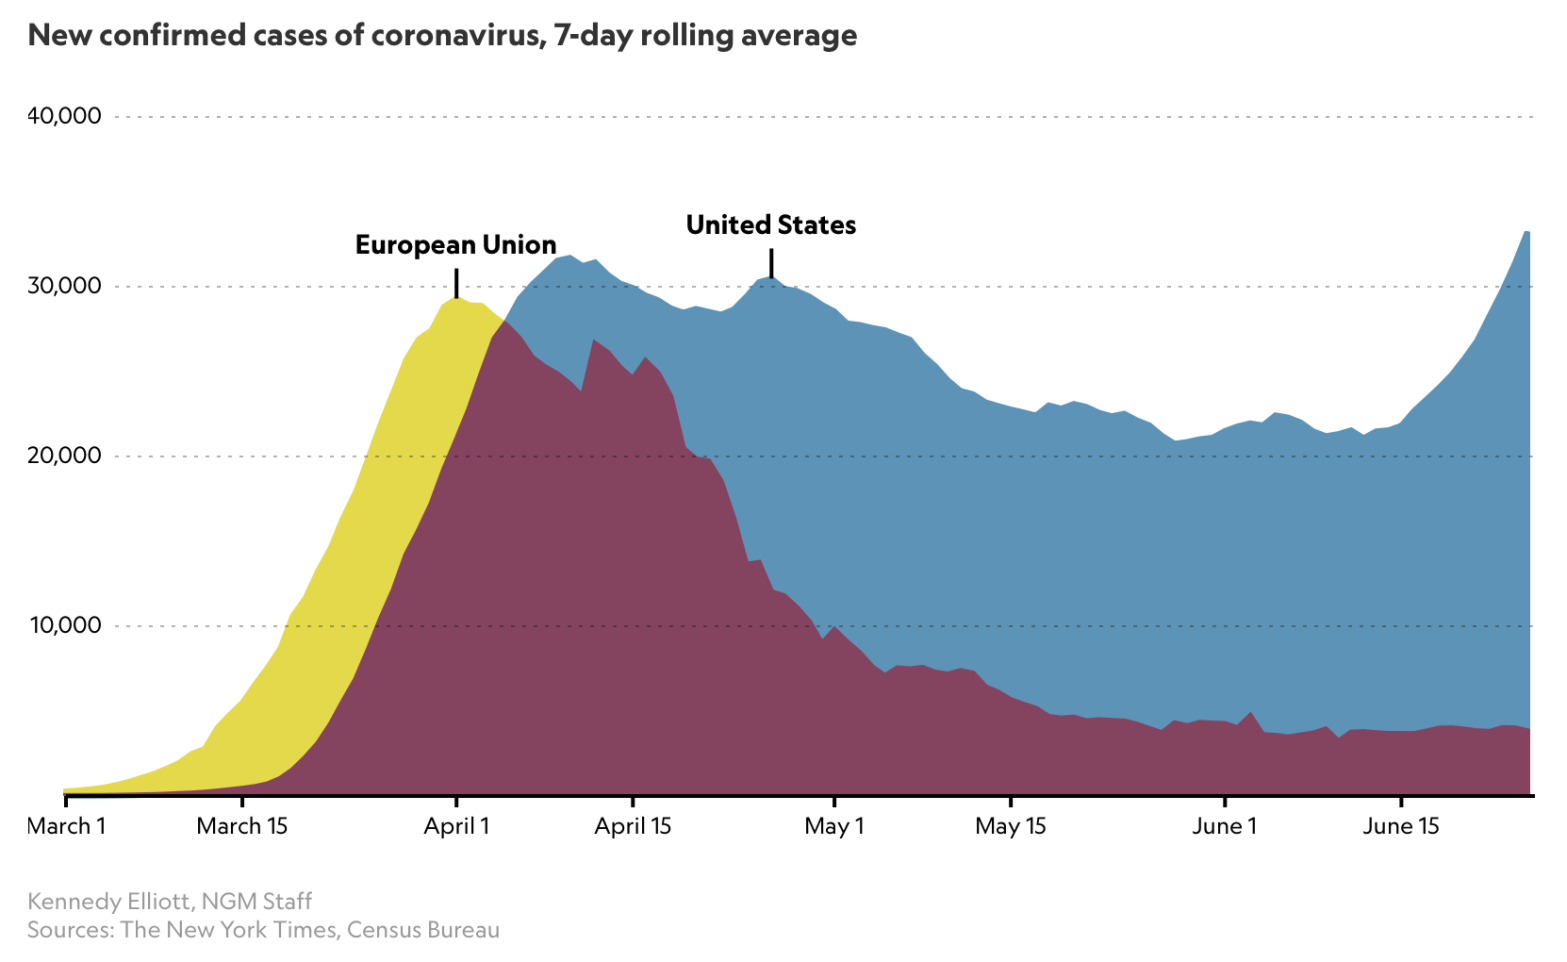
A couple of interesting articles on the Coronavirus pandemic came to my attention this week; a recent on in National Geographic on June 26, highlighting a starting comparison of the USA’s cases history and recent spike in case numbers with European data.
This article referred to an older National Geographic piece, from March, by Cathleen O’Grady, referencing a specific chart from Katy Armstrong of the Imperial College Covid-19 Response team.
I noticed, and was interested in that reference following a recent interaction I had with that team, regarding their influential March 16th paper.
Meanwhile, my own forecasting model is still tracking published data quite well, although over the last couple of weeks I don’t think the published rate of deaths is falling as quickly as before.
My model calculations for Coronavirus cases for an earlier UK lockdown
This post presents the two case number comparisons charts for the 9th March and 23rd March lockdown dates (I had covered the death data in more detail in my previous post on this topic).
