
Summary
While it is still early days with the Omicron variant, this post adds to my recent 19th December update with a summary of further parametric runs of my model for a range of higher transmissions settings.
I have included references to several research reports and commentaries which I use to assess settings for key parameters in my model, including virulence and mortality by variant, and vaccine efficacy by jab, 1, 2 or 3 jabs, also by variant. The model always assesses outcomes by population group, even when results are presented population wide.
Last time I ran options up to three times the transmission rate of the Delta variant, and I have now looked at a wider range of transmission rates, from twice up to five times that of Delta.
Introduction
Transmission rate in the model is set using k11, and for Delta this parameter is set at 1. I present results for 13 settings for k11 for Omicron, in steps from k11 = 2 to k11 = 5, i.e. from twice to five times the infection transmission rate for Delta.
I run the model for 1400 days, from February 1st 2020 (when the first UK cases were announced) to 3rd December 2023.
I will show only two charts in this post, both for k11 = 5, the highest setting for transmission in this post. I present a summary table of all outcomes for the full range of transmission rates considered.
Further details for some lower transmission rates with different virulence, mortality and vaccine efficacy settings can be seen in my 19th December post, but in this post I have set those to what seem to be more likely levels on the basis of what researchers are finding about Omicron at this point. Values of key parameters are listed under the variant definitions, in red text in the body of the charts .
Charts 318 and 303 for k11 = 5
The first chart 318 shows the comparison with UK Government Reported data on the pandemic for cumulative deaths (the thick black curve) and active cases (in thick red) up to the reporting date, 1st January 2022. NPI (Non-Pharmaceutical Intervention) changes, up and down are tabulated in the black text.
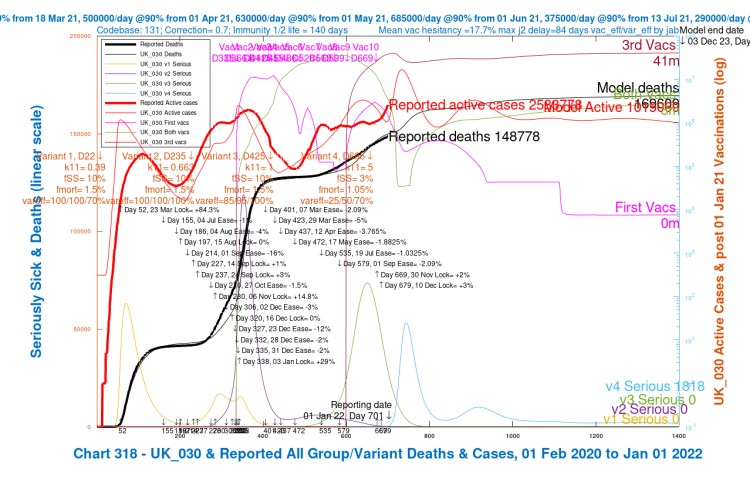
We see a very rapid growth until the peak in active cases (the thin red curve), up to a maximum of 17m cases, well above that for Delta, although the peak in Serious cases (the light blue curve) is relatively lower than for Delta, owing the reduced virulence (propensity to serious disease) I have set for Omicron at fSS = 3%, compared with fSS = 10% for Delta and other previous variants, the original “Wuhan“, and Alpha in the UK.
This was on the basis of reports that infection by Omicron might result in 70% less chance of serious illness / hospitalisation, information sourced from the UK Health Security Agency UKHSA Daily Bulletins on Omicron, which is supported by research I referenced last time.
Mortality is also set lower in all of the model runs in this post, at fmort = 1.05%, rather than the range I looked at last time, from 1.05% through 1.5% and up to 1.85%, since the recent studies seem to confirm lower mortality for Omicron
Modelled cumulative deaths at 3rd December 2023 stand at about 170,000 for this k11 = 5 scenario UK_030, and as we will see in the summary table later, the death rate is relatively less sensitive than the case rate to changes in the transmission rate.
We saw this in my previous post, where I also showed research evidence supporting lower virulence and mortality settings for Omicron. I am sure that further NPIs would be enacted were cases to show significant growth, which would reduce these projected outcomes accordingly. As it is, I have restricted NPIs just to the UK Government “Plan B” ones in late November/early December.
My second chart 303 shows the progress individually of the four variants we have seen so far in the UK – the original (v1 in the model), Alpha (v2), Delta (v3) and now Omicron (v4).

This chart is more complicated, but in summary it shows: Active and Serious cases by variant (8 curves); All Cases, Healthy (never infected), All infected and Deaths (4 curves); and the three vaccination volumes for first jabs, first plus second jabs, and all three jabs (3 curves altogether). This makes 15 plots in all. It looks a little like the London Tube map, but the colour-coded legend should allow each curve to be identified.
A key point to note is the very steep growth of v4 (Omicron) compared with previous variants, especially with the more directly comparable Delta variant, which also arrived after vaccination had started in the UK.
v4 also declines much more slowly, in waves, a surprising feature in the model, which I believe has its roots in the changing availability of susceptible people to Omicron, with re-infection of recovered people showing up periodically, owing to Omicron‘s very high infectiousness, which research has indicated allows a higher proportion of reinfection.
Immunity waning is also present in the model, and children younger than 12 are not yet vaccinated in the model. Vaccinations extend up to the first round of boosters starting in late September 2021.
Research on Omicron transmission and vaccine escape
I summarise below some further key research on Omicron, which along with references in my 19th December blog post, inform the settings I have made in my model.
The Juniper report on Omicron
I was led to this research report by the Twitter feed of Prof Graham Medley, who is chair of the Scientific Pandemic Influenza Group on Modelling (SPI-M), a sub-committee of the UK Government’s Scientific Advisory Group for Emergencies (SAGE).
The report by the University of Warwick and others indicates the higher potential for reinfection by Omicron, and a pdf of that report is available here. The authors represent the Juniper Consortium of Universities – the Joint UNIversities Pandemic and Epidemiological Research – which is a consortium of modelling groups from eight universities: Bristol, Cambridge, Exeter, Lancaster, Manchester, Oxford, LSHTM (London School of Hygiene & Tropical Medicine) and Warwick.
As this extract says:- “Throughout we have assumed that Omicron has the same generation time distribution as Delta – essentially the same latent and infection periods. However, the rapid increase of Omicron relative to Delta could partially be due to a shorter generation time; Omicron would still need to have a competitive advantage over Delta but this would be magnified by a shorter generation time. As such, if the generation time of Omicron was half that of Delta (so around 2.5-3 days instead of approximately 5-6 days), once the model is recalibrated to match the growth of SGTF [S gene target failure], this would approximately halve the predicted peak outbreak sizes.“
When they say “…competitive advantage over Delta…” they mean Omicron having a higher R0, something I have discussed before, in relation to a variant with higher R0 superseding one with lower R0. They go on to say:
“One unknown parameter throughout much of the pandemic has been the impact of vaccination on onward transmission — the reduction in transmission from a vaccinated individual (compared to a non-vaccinated individual) who becomes infected. We make the assumption that this reduction is 30%, in line with our estimates for Delta, but higher or lower values (either due to the booster or due to lower efficacy against Omicron) will impact the size of the Omicron wave.“
In my model I make corresponding assumptions about reduced infectivity of vaccinated individuals, depending on jab status – 1,2 or 3. As you see in the table below, I also set the parameter var_eff – the relative % efficacy of vaccines to Omicron for 1, 2 and 3 jabs compared with the efficacy to previous variants, 25%, 50% and 70% respectively for all of these model runs. var_eff acts as a multiplier on the basic setting for vaccine efficacy vac_eff which can vary by vaccination phase in the model.
I have used different settings too, for example 50%, 70% and 85%, for earlier parametric runs of my model in my previous December 19th blog post, comparing with the lower settings here for var_eff variant efficacy.
South Africa research on reinfection – Prof. Juliet Pulliam, Stellenbosch University, and others
The Juniper report says:-
“Since higher reinfection rates have been observed for Omicron than Delta [12], another indicator of the scale and speed of the omicron wave, as well as the extent of vaccine escape, is the proportion of cases that are reinfections” where [12] refers to work by Prof Juliet Pulliam of Stellenbosch University, et al. on “Increased risk of SARS-CoV-2 reinfection associated with emergence of the Omicron variant in South Africa”, which can be downloaded as a pdf here.
The report’s short summary states “Analysis of routine surveillance data from South Africa suggests that, in contrast to the Beta and Delta, the Omicron variant of SARS-CoV-2 demonstrates substantial population-level evidence for evasion of immunity from prior infection.“
I do have immunity waning set in my model, at different rates depending on the vaccination status – none, 1, 2 or 3 jabs, averaging at 140 days half-life – together with lower efficacy of vaccines towards Omicron, and this may well prolong the reinfections. There are many such settings in my model I have used for previous blog posts, and these will be explored further.
Additional research references
The following table published on Eric Topol’s Twitter feed lists some recent research papers on Omicron, the last two of which, the Cambridge R Gupta and Hong Kong MC Chi-wai papers, I summarised in the research section of my December 19th post, along with two other papers by Dr Nicole Wolter and Alex Sigal and their respective co-authors.

The previous five references in this table are studies on hamster or mice tissue, rather than in vitro experiments; the Cambridge US Katherine McMahan article, fifth in the list above, is typical of such studies, with a downloadable pdf here.
All of the papers support the lower infectivity of Omicron to lung tissue as distinct from viral load in upper airways, although many commentators emphasise that other symptoms of Covid-19 generally, and of Omicron in particular, in infected humans, including damage to other organs and “long Covid”, are not covered by any such studies.
The severity of such consequences are as yet unknown for Omicron, although at present, in the UK, hospitalisations are lower. It is too early to be absolutely sure about mortality.
The Omicron experience – virulence, mortality and immunity
Cases, hospitalisations and deaths
Now that Omicron has been in the UK for a while, there is more certainty about some aspects, such as its very high transmissibility.
The research findings above are also borne out in practice, with a far lower proportion of hospitalisations and ICU occupancy being reported compared to the steep rise in cases, and compared with earlier variants.

There hasn’t been a rise in the death rate either, and although this would take a little longer to show up, the reduced proportion of hospital admissions gives some hope that Omicron will continue to have lower mortality.
This picture is reflected in the excellent John Burn-Murdoch’s Twitter thread, which begins with what he describes as the most important chart, based on London statistics, but likely to be replicated elsewhere, as London has been in the vanguard for Omicron in the UK.
Omicron cases are very high, but Hospitalisations, ICU Ventilator bed occupancy and Deaths numbers are a small proportion of last winter’s values, when Alpha was the dominant strain.

Just to highlight that there are other opinions, this Twitter post from Dr Bob Wachter, a frequent commentator on the pandemic, asserts “The new Omicron math: somewhat milder x massively more infectious = overwhelmed hospitals and lots of deaths“. I think it’s overly morbid (to coin a phrase), and hope for better, but it does highlight that with very high infection rates, even a lower mortality rate might leave us with issues. It remains to be seen.
Immunity
I raised a further question in my previous blog post about the possibility of concurrent Omicron and Delta infections in one individual and/or in the population. A new term – “flurona” – has even been coined for infection by both influenza and Covid-19 at the same time, first reported as seen in Israel.
I see today (6th January) that Prof Francois Balloux, who has previously and recently published in the field of SARS-Cov-2 cross-immunity, is reported by the Times as saying “For some reason that is not entirely clear, the cross-immunity between Delta and Omicron doesn’t seem to be completely symmetric“.
It would seem, in that case, that Delta and Omicron might not coexist together in the population, as had been suggested as a possibility by Dr Trevor Bedford of the Fred Hutchinson Research Institute, who was reported in The Times a few weeks ago in an interesting article as saying “Omicron and Delta may be able to co-exist, having distinct ecological niches”.
Instead, it seems that immunity conferred by Omicron infection is restricting infection by Delta, although prior infection by Delta might not protect against Omicron. For all three previous variants – the original Wuhan, Alpha and Delta – such cross-immunity was symmetric.
As Omicron infection seems less severe, however, this might not be bad news, because if so, a less dangerous variant, Omicron, would be supplanting a more dangerous one, Delta. As Prof Francois Balloux of UCL said “It will be be really great for Delta to go extinct – that would be the most wonderful legacy of the Omicron wave.“
An additional factor is that human T-cells, part of our immune system, have long memories, and are unlike other antibodies that only respond to a small part of the spike of a virus variant.
T-cells are separate mechanism of our immune system, and respond to a randomly chosen broader spectrum of the virus components, not just the spike. As this “random” selection of components is different in different people, it is harder for a variant to evade immunity widely in the population.
Prof Graham Medley is quoted in the same Times newspaper report as summarising this by saying” . . . if your first experience of Covid does not put you in hospital, then your second will not either.”
This article at The Centre for Evidence-Based Medicine describes the different roles of T-cells and B-cells in the human body’s immune system, with particular reference to Covid-19.
Model settings and outcomes
In order for my model to reflect the high levels of growth in infections we have seen in the first month or so of Omicron, a very high setting for transmission seems necessary. Setting k11 = 5 in the charts for this blog post might well be too high, but it is useful to compare the various settings up to that level, including from my 19th December blog post and also from my first post specifically on Omicron on 10th December.
In summary, for this value of k11 = 5, the peaks of Omicron infection in the model, and the dates when it overtakes Delta in terms of current numbers of Active and Serious cases are:
- Peak Omicron active cases @ 731 days ≡ February 1st 2022;
- Omicron active cases supersede Delta @ 700 days ≡ January 1st 2022; and
- Omicron Serious cases supersede Delta @ 716 days ≡ January 17th 2022;
where days are counted from February 1st 2020, when the first Covid-19 cases were noted in the UK, and when my model simulation begins.
The peaks would be lower, and at later dates as we see from the table below, and the superseding dates would also be later for lower transmission rate settings. The peaks in Serious cases for Omicron are always a few days later (up to two weeks) than for Active cases, owing to the time taken for infections to develop to the serious level.
The variations, for the different transmission rates k11, in timing and extent of the peaks in Active cases (each followed by a peak in Serious cases after a few days) can be seen in the table below.
Table of model outcomes
I ran the model (some results of which were also presented in previous posts for different settings for fSS, fmort and var_eff) for values of transmission rate k11 from 2 to 5 in steps of 0.25. The scenario UK_030 for k11 = 5, which I showed in the charts above, is last in the table below, with the highest outcomes for cases and deaths.
For all runs, var_eff for Omicron is set to 25%, 50% and 70% for jabs 1, 2 and 3 respectively, representing the relative vaccine efficacy to Omicron compared with the equivalent efficacies for earlier variants, acting as a multiplier on the basic efficacy of vaccines, vac_eff.
That underlying efficacy of vaccines, the vac_eff parameter in the model, can vary by vaccination phase (10 of these at present).
NPIs are set at an additional 2% on November 30th, with a further 3% uplift on December 10th, as shown in the body of the charts above, reflecting the UK Government’s current “Plan B” restrictions.
These Plan B restrictions have remained unchanged in England until the beginning of 2022, and having been reviewed on 5th January, will end on 26th January, unless extended. The other three UK home countries – Scotland, Wales and Northern Ireland – have set similar, but somewhat more stringent restrictions.
fSS and fmort, the virulence and mortality, are set in the model at 3% and 1.05% respectively, compared with 10% and 1.5% for previous variants. These settings are influenced by the research outlined earlier.
| Scenario | k11 | Peak active cases day | Peak active cases date | Peak active | Peak serious | 3/12/23 active | 3/12/23 deaths |
|---|---|---|---|---|---|---|---|
| UK_300 | 2 | 992 | 20/10/22 | 1.5m | 3,000 | 1,270 | 153,419 |
| UK_310 | 2.25 | 902 | 22/07/22 | 4m | 10,000 | 3,506 | 155,983 |
| UK_320 | 2.5 | 856 | 6/6/22 | 5m | 19,000 | 98,783 | 157,775 |
| UK_330 | 2.75 | 824 | 5/5/22 | 6m | 22,000 | 410,682 | 159,377 |
| UK_340 | 3 | 801 | 12/4/22 | 8m | 28,000 | 380,407 | 160,813 |
| UK_070 | 3.25 | 786 | 28/3/22 | 9m | 32,000 | 575,540 | 162,192 |
| UK_080 | 3.5 | 774 | 16/3/22 | 10m | 35,000 | 831,974 | 163,574 |
| UK_090 | 3.75 | 762 | 4/3/22 | 11m | 40,000 | 832,789 | 164,870 |
| UK_020 | 4 | 754 | 24/2/22 | 12m | 43,000 | 742,155 | 166,009 |
| UK_060 | 4.25 | 743 | 13/2/22 | 13m | 45,000 | 742,143 | 167,010 |
| UK_040 | 4.5 | 739 | 9/2/22 | 14m | 48,000 | 826,861 | 167,923 |
| UK_050 | 4.75 | 735 | 5/2/22 | 15m | 51,000 | 935,059 | 168,785 |
| UK_030 | 5 | 731 | 1/2/22 | 17m | 54,000 | 1,015,069 | 169,609 |
In the chart of the main outcomes in this table, plotted against k11 below, we see that the Active Cases (the yellow curve) and their timing are relatively more sensitive to the k11 setting, with Serious cases (in red) also increasing rapidly (by a factor of 18) over the range of transmission rates. Cumulative deaths (in black) are much less sensitive to transmission rate, increasing by 10% across that range k11 settings.

The dips in the yellow curve for Active cases are, I believe, a manifestation of the different phasing of the waves of growth in infections at different transmission rates, as individuals recover, and then can be reinfected later on, in a cycle of events; the 3rd December 2023 outcomes date happens to intersect the waves in the Active cases curve (see Chart 303 above) at different points relative to its periodic maxima for different settings of k11.
The Serious cases growth for high transmission rates would be of concern to the UK Government and the NHS (National Health Service), where the effect would be seen in more hospitalisations and increased demand for ICU (Intensive Care Unit) beds. At present, these rates are lower, however, than they were for Delta, owing to the perceived reduced virulence and mortality for Omicron, as also allowed for in my model settings for fSS and fmort.
Concluding Comments
With the increasing research activity, I expect that it won’t be too long before the Omicron situation clarifies, and transmission rates and other parameters can be assessed more accurately.
An additional setting I will explore would be a reduction in incubation period (or generation time, perhaps) for Omicron from about 5 days to 3 days, as suggested in the research papers I mentioned above, which I will report a later post should it prove useful.
Meanwhile, parametric studies (somewhat like this one) conducted by UK Government advisers such as Imperial College, the London School of Hygiene and Tropical Medicine (LSHTM) and Warwick University continue to inform the decisions made concerning NPIs (Non-Pharmaceutical Interventions), and, as the reports and outcomes are made more widely known, to some extent influence the public responses to them.
Political decisions have varied across the four home countries in the UK, with less restrictions currently in England than for Scotland, Wales and Northern Ireland. Time will tell if the symptoms caused by Omicron are milder, as most seem to think, but also whether the projected overall infected numbers will cause too many serious cases for the NHS to be able to manage without further NPI restrictions.
As I said last time, even though Omicron might cause less severe infection, the sheer number infected, because of Omicron’s high transmission rate, means that Serious cases, even as a lower proportion of Active cases, a very much higher number of infected people, can still amount to a worryingly large number.
I have no doubt that further actions on NPIs would be taken if numbers were to grow at such rates, and so the outcomes in my model should be seen as worst case for any given transmissibility.
As always, I am indebted to Prof Alex de Visscher for his original model, and for his work with Dr Tom Sutton and me to add some of the functionality reported here. Errors and omissions are all mine!

One thought on “A first 2022 Omicron update – Coronavirus”