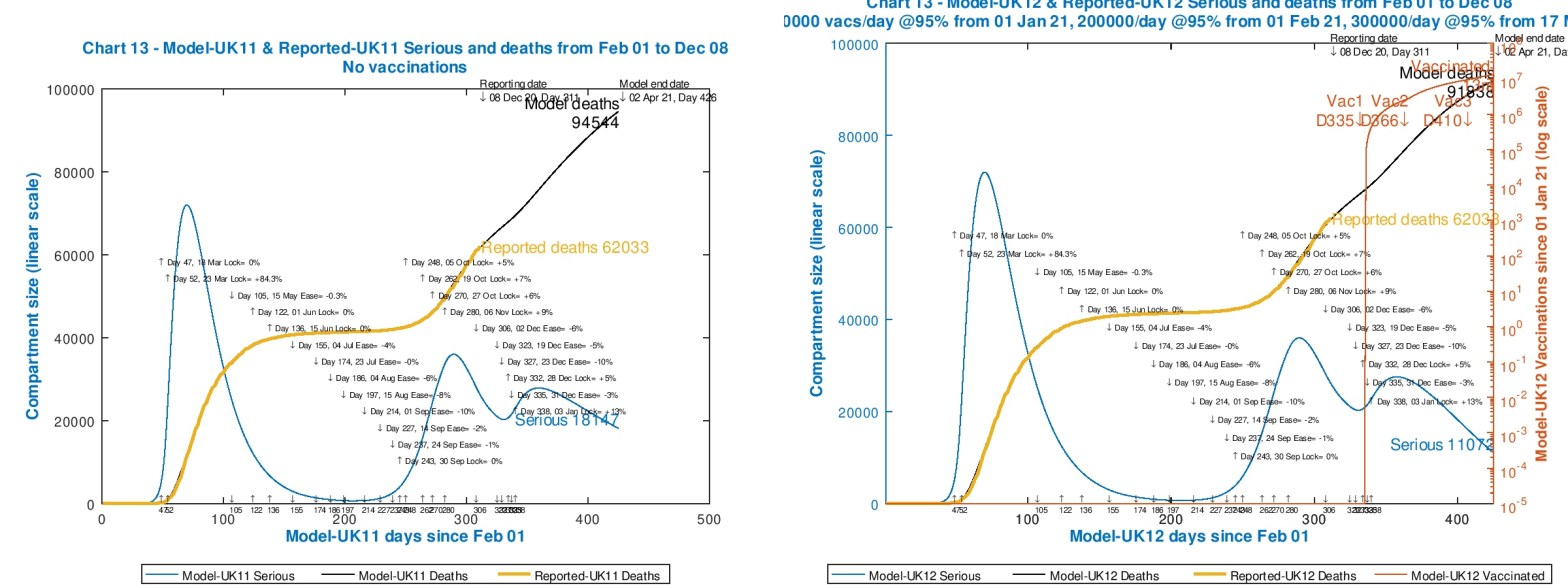
We are aware that the rates of cases and deaths in the USA have increased steeply recently, and it seems that the natural public relaxation in precautions against Covid-19 for the Thanksgiving holiday period have exacerbated this. I have run my model with reductions to the USA intervention effectiveness during the Thanksgiving period (reflecting the increase in travel and social interactions in the USA) followed by reintroduction of the intervention effectiveness afterwards, to see the effect on the immediate projections. I have then applied similar changes to my UK models, to anticipate what the possible effect of such relaxations over the UK festive period might be. This is very much a sensitivity test of some scenarios, not a forecast.
Tag Archives: forecasting
Adaptive triggering and the Coronavirus epidemic life-cycle

Introduction In my last post on October 21st, looking at the potential for an exit from the epidemic, I described a cyclical version of the modelling of the epidemic in the UK, reflecting outputs from Imperial College and Harvard earlier this year, which postulated a continuing cycle of partial lockdowns, easing of restrictions and upsurgesContinue reading “Adaptive triggering and the Coronavirus epidemic life-cycle”
Coronavirus model updates for UK lockdown easing points
As I reported in my previous post on 31st July, the model I use, originally authored by Prof. Alex de Visscher at Concordia University on Montreal, and described here, was to be updated to handle several phases of lockdown easing, and I’m glad to say that is now done. Alex has been kind enough already to adopt a method I had been considering, of introducing an array of dates and intervention effectiveness parameters, and I have been able to add the recent UK Government relaxation dates, and the estimated effectiveness of each into a new model code. I have run two sets of easing parameters as a sensitivity test.
The effect of lockdown easing in the UK – Coronavirus
As reported in my previous post, there has been a gradual reduction in the rate of decline of cases and deaths in the UK relative to my model forecasts. This decline had already been noted, as I reported before, by The Office for National Statistics and their research partners, the University of Oxford, and reported on the ONS website.
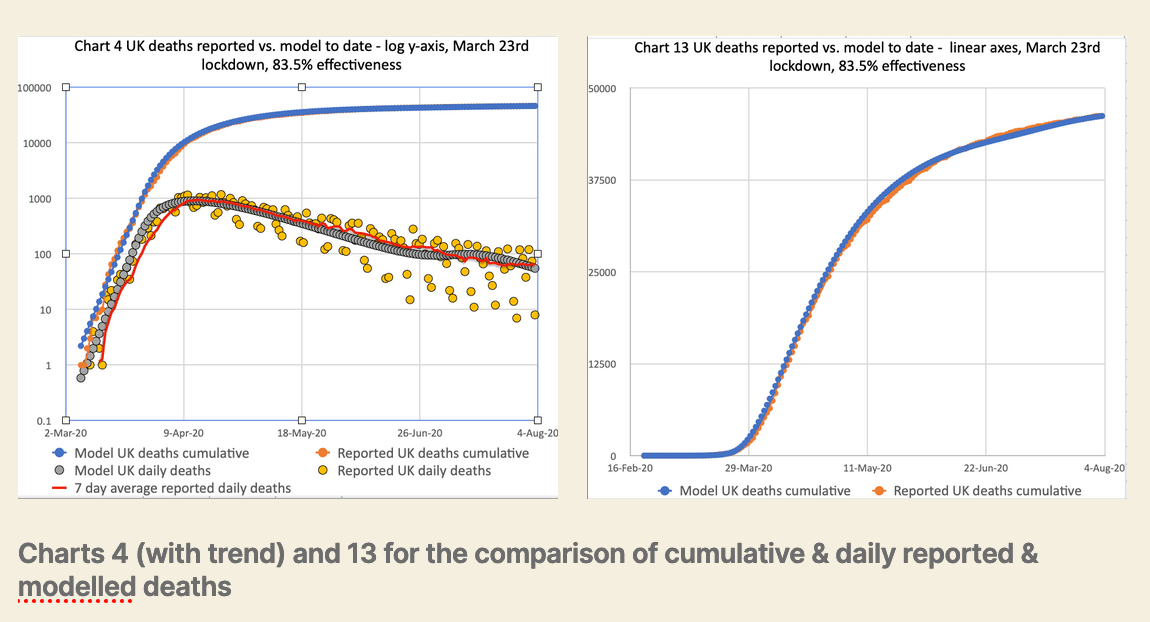
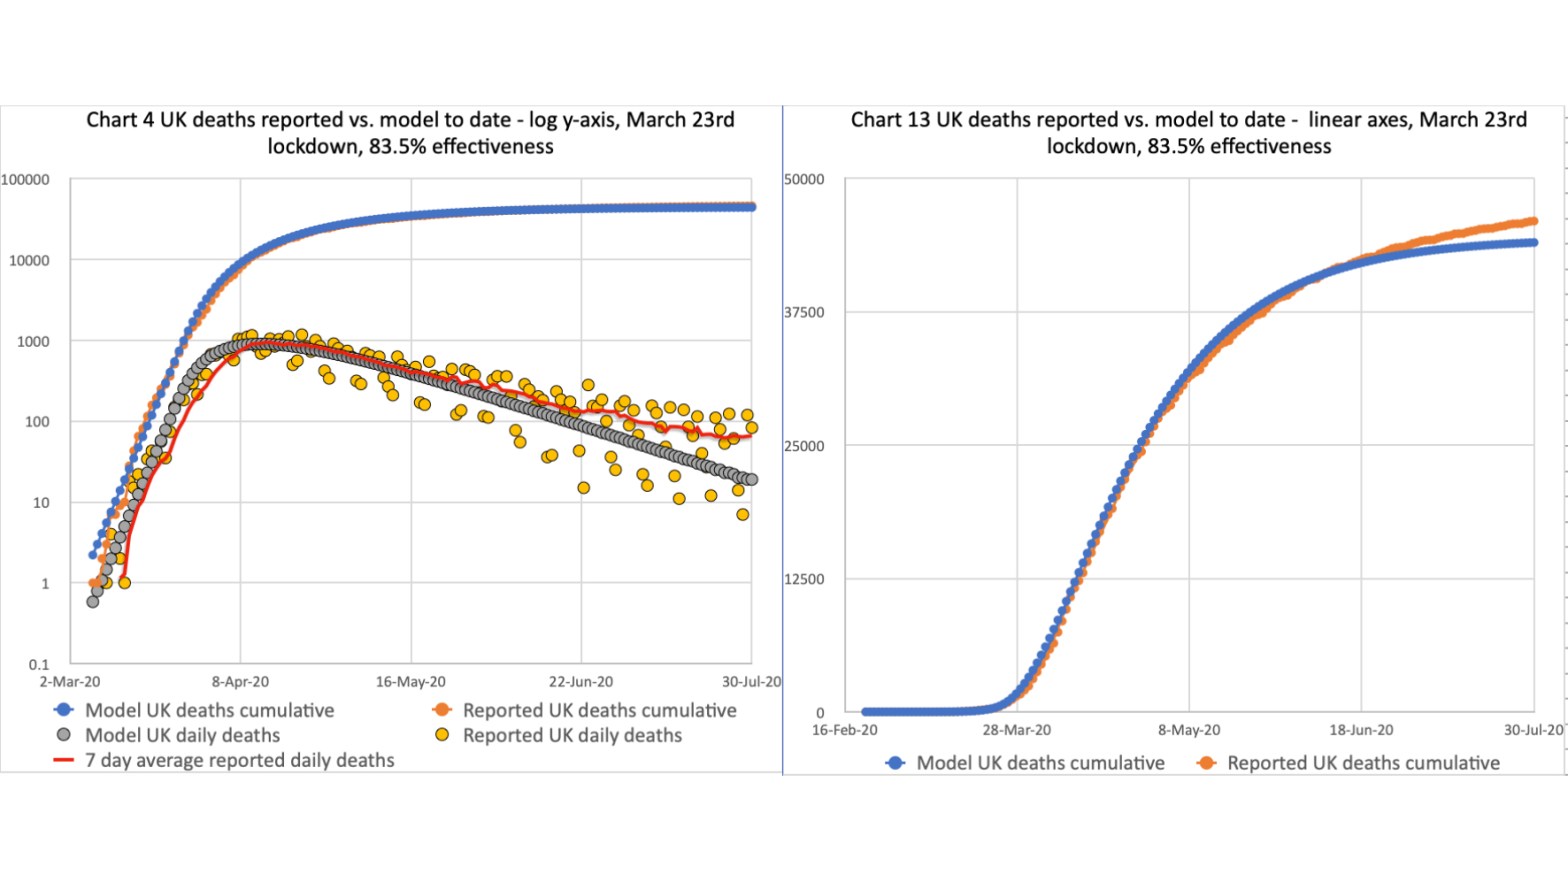
I had adjusted the original lockdown effectiveness in my model (from 23rd March) to reflect this emerging change, but as the model had been predicting correct behaviour up until mid to late May, I will present here the original model forecasts compared to the current reported deaths trend.
Coronavirus modelling update
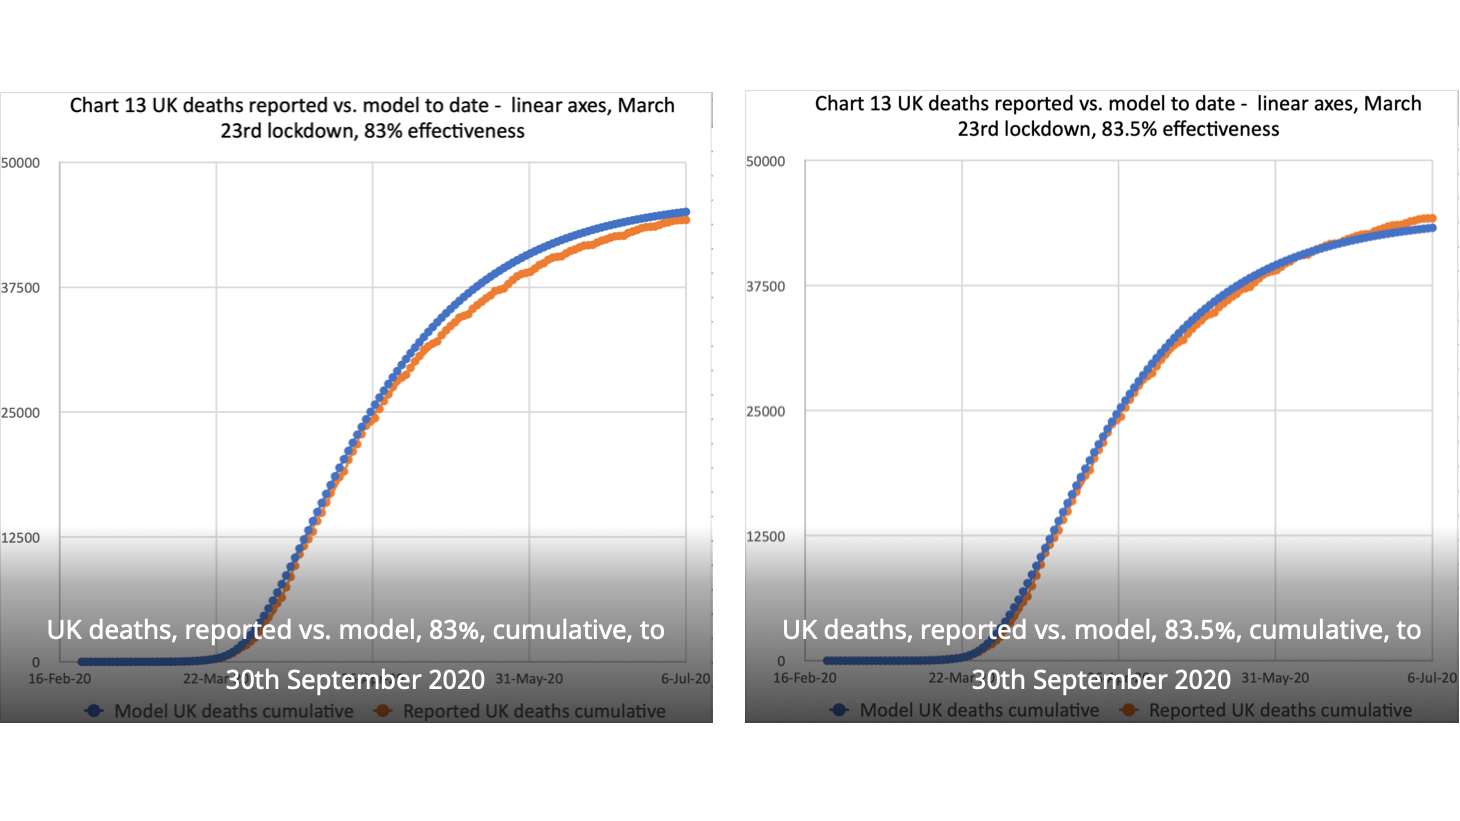
I have now reforecast my model with a slightly lower intervention effectiveness (83% instead of 83.5%), and, while still slightly below reported numbers, it is nearly on track
Coronavirus modelling work reported by the BBC
This article by the BBC’s Rachel Schraer explores the modelling for the progression of the Coronavirus Covid-19. In the article we see some graphs showing epidemic growth rates, and in particular this one showing infection rate dependency on how many one individual infects in a given period. https://www.bbc.co.uk/news/health-52056111 This chart led me to look intoContinue reading “Coronavirus modelling work reported by the BBC”
Coronavirus – possible trajectories
I guess the UK line in the Johns Hopkins chart, reported earlier, might well flatten at some point soon, as some other countries’ lines have. But if we continue at 3 days for doubling of cases, according to my spreadsheet experiment, we will see over 1m cases after 40 days. See:https://docs.google.com/spreadsheets/d/1kE_pNRlVaFBeY5DxknPgeK5wmXNeBuyslizpvJmoQDY/edit?usp=sharingand the example outputs attachedContinue reading “Coronavirus – possible trajectories”
Coronavirus – forecasting numbers
A few people might have seen the Johns Hopkins University Medical School chart on Covid-19 infection rates in different countries. They have produced many different outputs, some of them interactive world incidence models – see https://coronavirus.jhu.edu/map.html. This particular chart usefully compares some various national growth rates with straight lines representing different periods over which theContinue reading “Coronavirus – forecasting numbers”
