Implications of the R0 Reproduction Number in an unconstrained Delta variant environment

In my April 8th 2020 post about the R0 reproduction number and the use of SIR models to model the pandemic, I developed a chart which predicted the proportion of the population uninfected by the end of an unconstrained pandemic.

That chart allowed for an R0 up to 3, but the Delta variant that arrived in the UK a year later, in April 2021, has an R0 far higher than the original, possible 2.5 times as high, as much as R0=7, perhaps.

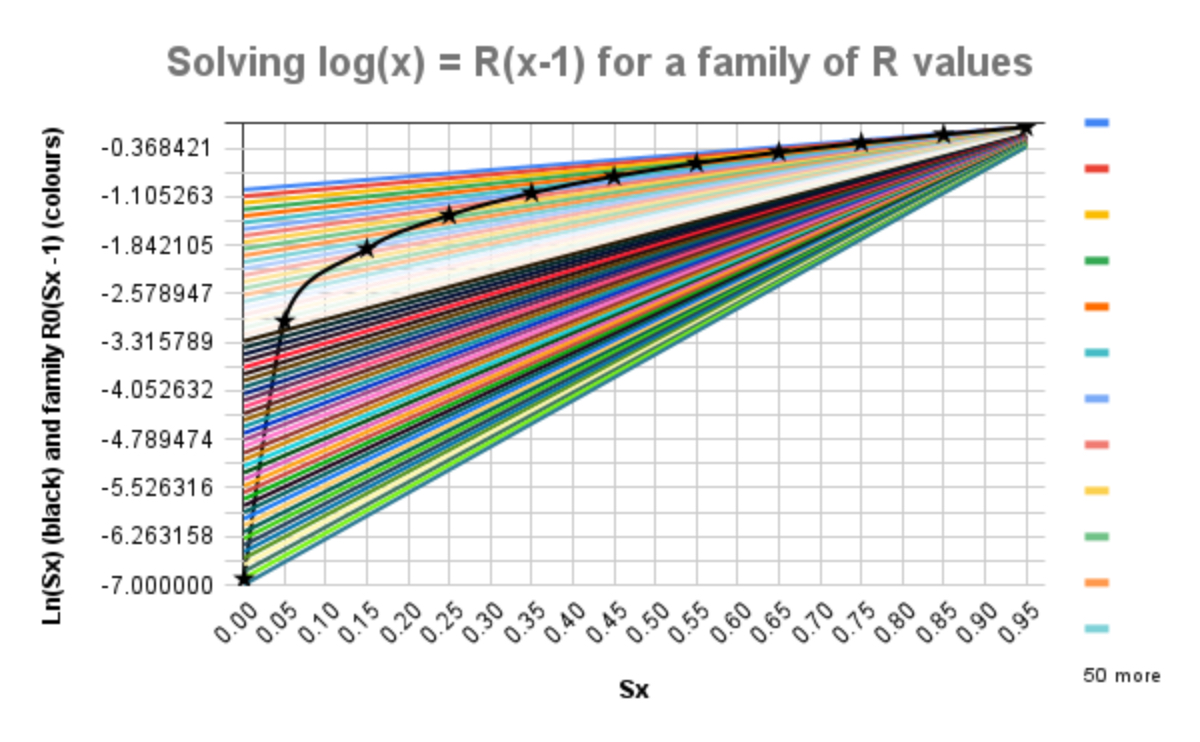
I have added to the scope of that previous post to develop a chart allowing R0 up to 7..

Where’s the exit?

My title for this post is drawn from a slide I have shown before, from the 17th April Cambridge Conversation webinar, which I reported in my April 17th blog post, and also in my April 22nd blog post on model refinement, illustrating the cyclical behavior of the Covid-19 epidemic in the absence of pharmaceutical interventions, with control of cases and deaths achieved, only to some extent, by Non-Pharmaceutical Interventions (NPIs).

Phenomenology & Coronavirus – modelling and curve-fitting

There is a range of modelling methods, successively requiring more detailed data, from phenomenological (statistical and curve-fitting) methods, to those which seek increasingly to represent the mechanisms (hence “mechanistic” modelling) by which the virus might spread.

We see the difference between curve-fitting and the successively more complex models that build a model from assumed underlying interactions, and causations of infection spread, between parts of the population.