
In my latest post on March 26th I described a new Coronavirus group model, based on work I had done as a UK case study in support of Prof. Alex de Visscher’s paper, in conjunction with Dr. Tom Sutton, on “Second-wave Dynamics of COVID-19: Impact of Behavioral Changes, Immunity Loss, New Strains, and Vaccination” which has now been published for peer review as a pre-print on Springer’s site at https://www.researchsquare.com/article/rs-195879/v1. I have now added the latest UK vaccination progress figures, and the UK Government’s announced intentions for the near future regarding Non Pharmaceutical Interventions (NPIs). I have also updated mortality and infection characteristics for the four different population groups in the model.
Category Archives: Reproductive Number
Concurrent Coronavirus two variant modelling

I present an analysis of the pandemic situation in the UK, with two Coronavirus variants present since December 16th, and sensitivities to different New Year 2021 Non Pharmaceutical Interventions (NPIs), but always with the background of vaccine dispensing, which started in the UK on December 8th.
Vaccine, vaccine, vaccine, vaciiiine,…(don’t refuse it, just because you can) Coronavirus

In the news today, I read that Dolly Parton had given $1,000,000, through her Covid-19 Research Fund, to help fund the Moderna vaccine development. As The Times newspaper reported, this – erm – somewhat trumps the White House contribution to public safety. In her honour, Ryan Cordell composed and performed this ditty. The timing neatly coincides with the work I have been doing to incorporate vaccination into my Coronavirus model, and to that end I have been researching ways of modelling vaccination. I have made some appropriate changes, and run some model options for different vaccine efficacy; vaccinations per day; and date of starting the vaccination programme.
Phenomenology & Coronavirus – modelling and curve-fitting

There is a range of modelling methods, successively requiring more detailed data, from phenomenological (statistical and curve-fitting) methods, to those which seek increasingly to represent the mechanisms (hence “mechanistic” modelling) by which the virus might spread.
We see the difference between curve-fitting and the successively more complex models that build a model from assumed underlying interactions, and causations of infection spread, between parts of the population.
Some thoughts on the current UK Coronavirus position
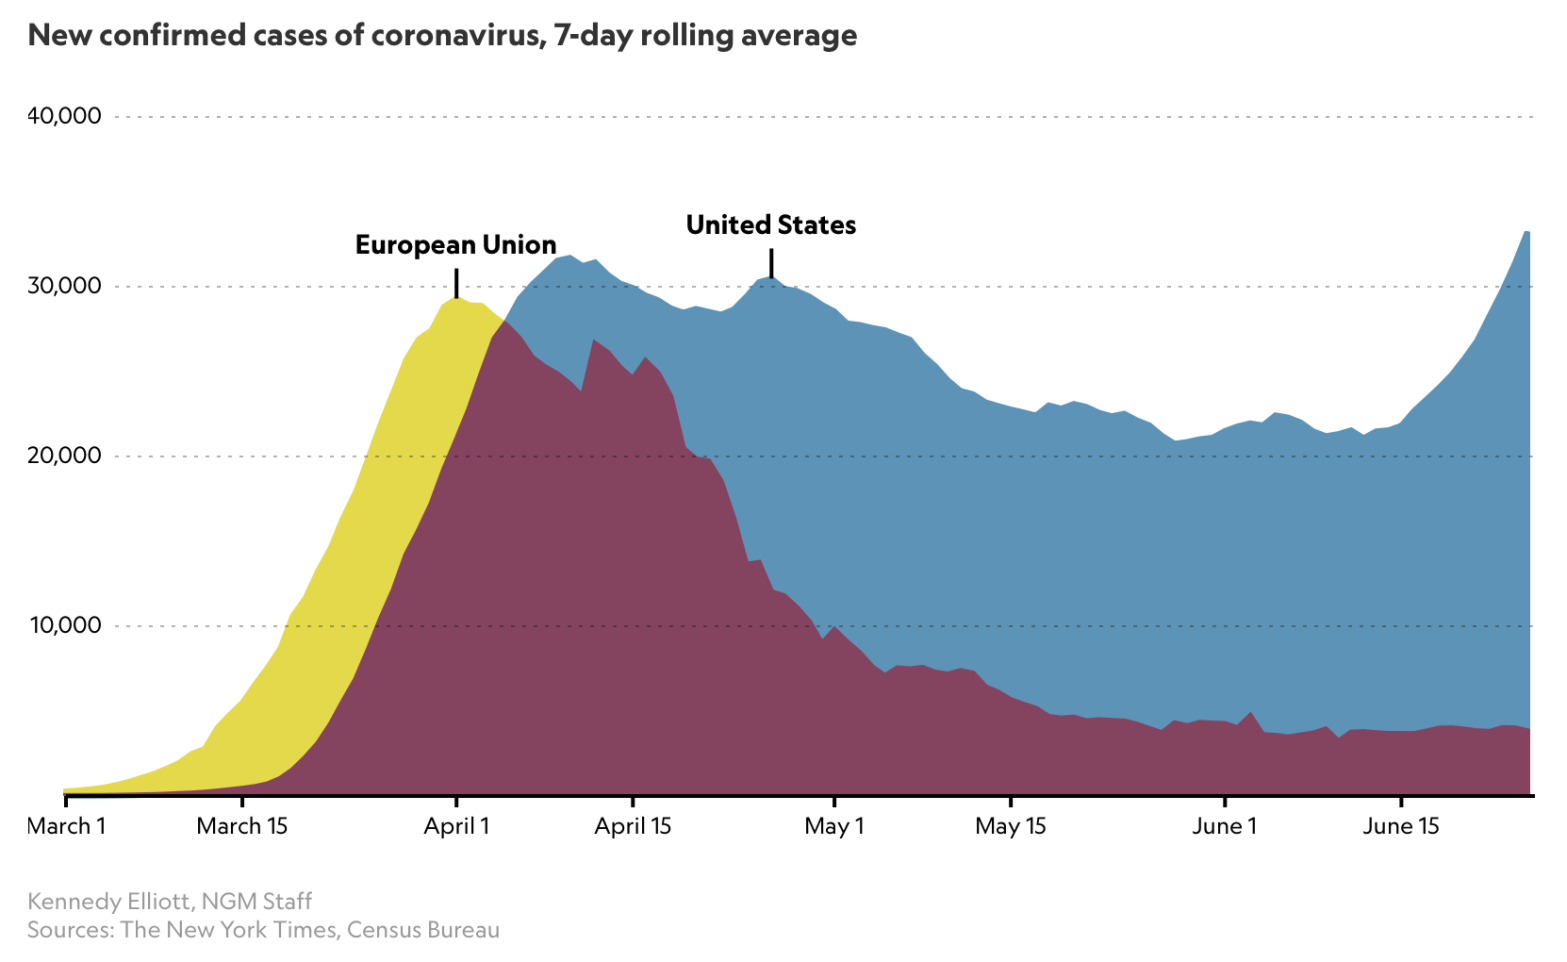
A couple of interesting articles on the Coronavirus pandemic came to my attention this week; a recent on in National Geographic on June 26, highlighting a starting comparison of the USA’s cases history and recent spike in case numbers with European data.
This article referred to an older National Geographic piece, from March, by Cathleen O’Grady, referencing a specific chart from Katy Armstrong of the Imperial College Covid-19 Response team.
I noticed, and was interested in that reference following a recent interaction I had with that team, regarding their influential March 16th paper.
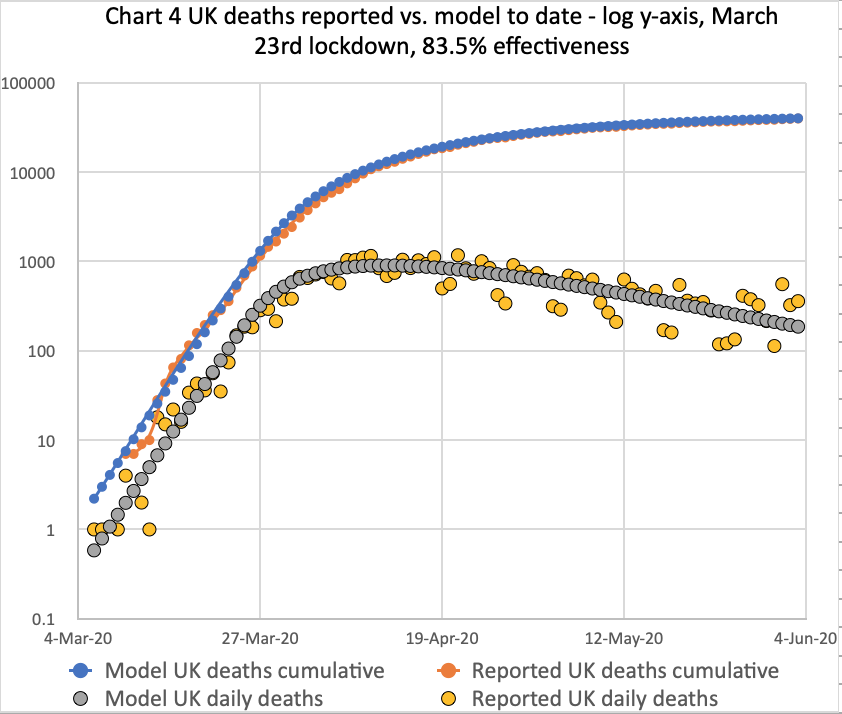
Meanwhile, my own forecasting model is still tracking published data quite well, although over the last couple of weeks I don’t think the published rate of deaths is falling as quickly as before.
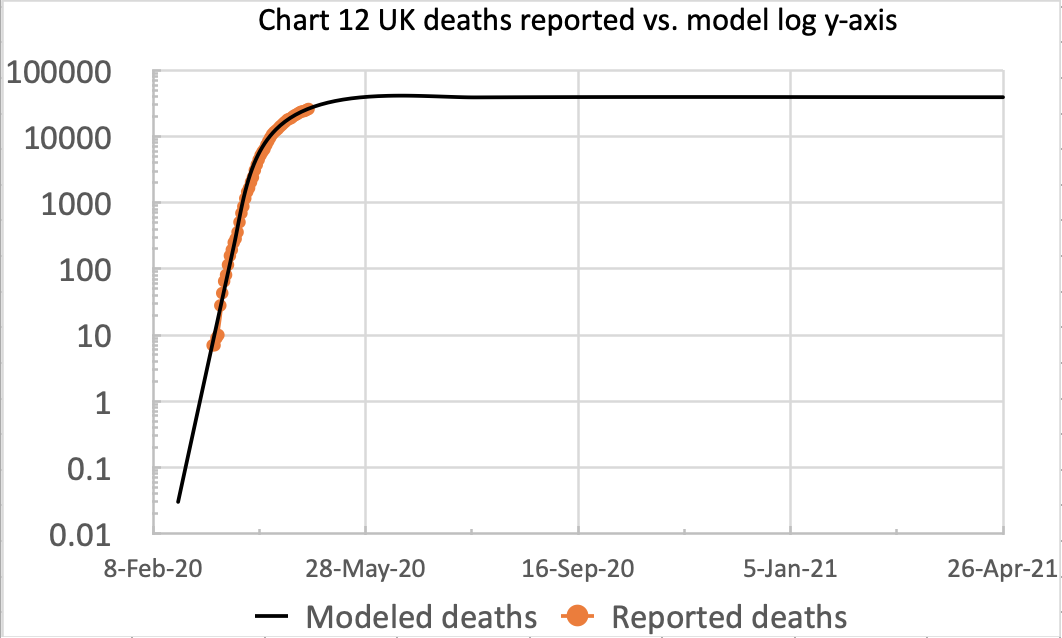
Current Coronavirus model forecast, and next steps
My model is currently fitting deaths data for the UK, on the originally modelled basis of Government published “all settings” deaths. I plan to compare results by looking at the Gompertz function and Sigmoid charts that Michael Levitt uses.
Another perspective on Coronavirus – Prof. Michael Levitt
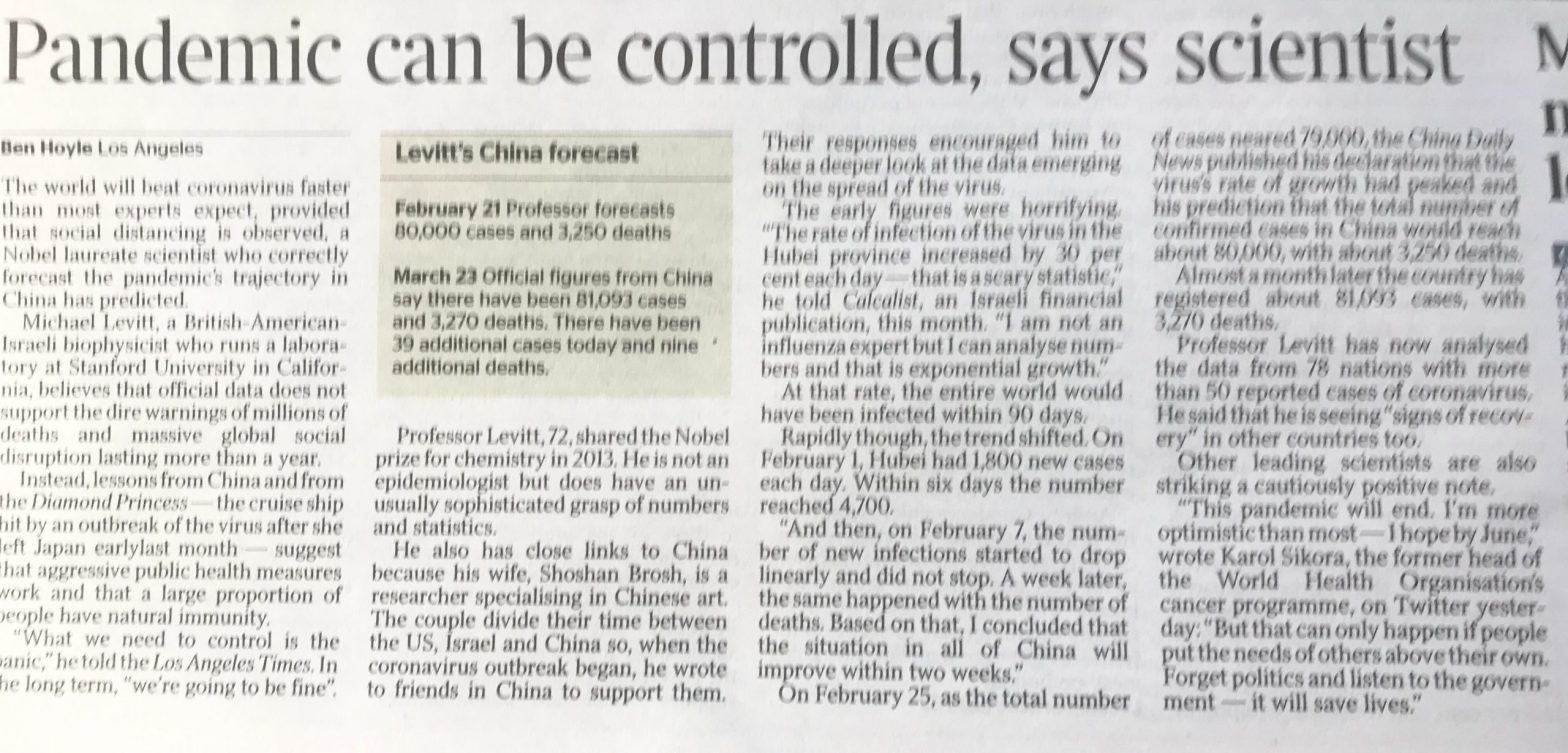
Owing to the serendipity of a contemporary and friend of mine at King’s College London, Andrew Ennis, wishing one of HIS contemporaries in Physics, Michael Levitt, a happy birthday on 9th May, and mentioning me and my Coronavirus modelling attempts in passing, I am benefiting from another perspective on Coronavirus from Michael Levitt.
Model update for the latest UK Coronavirus numbers
This is a brief update to my model predictions in the light of a week’s published data regarding Covid-19 cases and deaths in all settings – hospitals, care homes and the community.
Re-modelling after changes to UK Coronavirus data collection and reporting

The UK Government yesterday changed the reporting basis for Cononavirus numbers, retrospectively (since 6th March 2020) adding in deaths in the Care Home and and other settings, and also modifying the “Active Cases” to match, and so I have adjusted my model to match.
The SIR model and importance of the R0 Reproductive Number – Coronavirus

In the recent daily UK Government presentations, the R0 Reproductive Number has been mentioned a few times, and with good reason. Its value is as a commonly accepted measure of the propensity of an infectious disease outbreak to become an epidemic. It turns out to be a relatively simple number to define, although working backContinue reading “The SIR model and importance of the R0 Reproductive Number – Coronavirus”
