Summary
There is increasing concern about new SARS-Cov-2 variants that might escape vaccines to some extent, as well as having higher transmission rates (as the Kent variant does), and causing different severity of illness with higher mortality.
In this post I look at the potential impact of such a variant in the UK, by adding a vaccination variant efficacy modifier, var_eff, by variant, as a multiplier to the standard vaccination efficacy, vac_eff. This allows me to model potential variants that have a partial or total capability to escape vaccines, and I show how that might work, using a third variant introduced to the model on January 1st 2021.
In addition, I have modified fSS (the fraction of people becoming seriously sick from each variant) and fmort (the mortality of each variant) in the model, which allows fuller characterisation of any variant.
Charts show how the 2021 arrival of a putative third variant affects the modelled progress of the epidemic in the UK, by population group and variant.
Introduction to the Coronavirus model structure
In my most recent blog post on April 14th, I was tuning the UK Coronavirus model based on Prof Alex de Visscher‘s original work on a grouped Covid-19 pandemic model. Our work on this model with a UK case-example was submitted as a paper with Dr Tom Sutton on January 31st to the Springer journal Nonlinear Dynamics, and is currently available at Research Square, in review.
It showed that a vaccination programme can help alleviate the upwards impact of lockdown relaxations on case and death rates, and this is confirmed by my more recent work, as well as the UK’s experience in practice.
My original single population model is still working well, but I am now focusing on developing this “age and vulnerability” group model, which allows me to differentiate outcomes for particular age and vulnerability population groups, as described in my latest blog and also my March 26th blog post.
Compartments (states)
My flowchart for this new model has 64 compartments, as described in my April 14th blog post, leading to the following structure. In the diagram, “i” labels the variants, and “j” labels the groups.
There are Uninfected (U), Vaccinated (V), Recovered (R) and Deceased (D) compartments for each of 4 groups (4×4=16 compartments).
There are also Infected/Incubation (I), Sick (S), Seriously Sick (SS) and Better (B) compartments for each variant within each group, which require a further 4x4x3 = 48 compartments for the 4 groups and 3 variants (although there can be more if required). Thus the model discussed in this post comprises 64 compartments in all. Think of the complete chart below as multi-layered.
For each population group there is one main layer, with U(j), V(j), R(j) and D(j) for each population group j.
In addition, within each main layer j, there is a sub-layer for each variant i for the four infected compartments, I(i,j), S(i,j), SS(i,j) and B(i,j), sub-layered together.

Compartment transition rates
More detail on the mathematics of the model is available in our paper.
The “r” values in the chart represent the rates of transition of people per day between the different compartments (states). For example, r8(j) is the rate of vaccinations per day in group “j“, taking people in the model from U(j) to V(j).
r20(j) for any group j represents “waning”immunity, set at a “half-life*” of 150 days in model runs in this post, taking people from the recovered state R(j) back to the Susceptible Uninfected state U(j) for that group j. A *half-life of 150 days means that on average, 50% of newly immune people become susceptible again within 150 days. The r20 parameter, as for any r values, can be changed for any model run.
Other r rates relate to transitions between, from and to the various infected states Incubation, Sick, Seriously Sick (SS) and Better, and partly depend on half-lives set for Covid-19 infections at various levels of severity.
These rates also depend on the different variant i infection rates from infected people in each of the I(i,j), S(i,j), SS(i,j) and B(i,j) compartments in each group j, for each variant i, that infect Uninfected people in the group, who then transfer, in the model, to the Incubation compartment I(i,j) for variant i within that group j.
A primary rate is r1(i,j), the transition rate of newly infected people per day from the Uninfected (Susceptible) state U(j) to the Incubation state I(i,j) for group “j” and variant “i“. The other “r” rates work similarly.
For each group j, those who have become Sick at rate r2 from in the Incubation state, can either go on to become Better (but still potentially infective) at rate r5. Otherwise they become Seriously Sick at rate r3, from where they can also become Better, at rate r6, but in some cases Die, at rate r4.
These rates depend on the settings for fSS(i,j) (the rate at which people can become seriously sick) and fmort(i,j) (the mortality rate) for each group j and variant i.
The Better compartment is a (still potentially infective) transition state from either of the Sick or Seriously Sick states; people move from the Better to the Recovered state at rate r7.
Those who have been successfully Vaccinated (in compartment V) will transition to the Recovered state at a rate r10, a rate defined by the vaccination efficacy vac_eff, modified by the vaccination variant efficacy coefficient var_eff, which, if vac_eff and var_eff are high enough (vac_eff=85% and var_eff=70% for example) would be the majority of vaccinated people (~60% in that case).
People in the remaining fraction of V, for whom the vaccine wasn’t efficacious, will go to the Incubation state at rate r9, a rate dependent on vac_eff, var_eff and the infection rate r1, since they have remained susceptible to infection after their ineffective vaccinations.
Cross-infection between population groups
There are cross-contamination infection rates (involving a cross_contam factor) such as k11(m,j,k) between pairs (j,k) of population groups in the model, for each variant m, derived from the geometric means of the relevant infection rates within both of the groups involved. In the case of k11, for example, which is a key infection rate per person per day in the model from the Incubation state to susceptible people, the cross-infection rate k11(m,j,k) is given by
sqrt(k11_(m,j)×k11_(m,k))×cross_contam, for j≠k, or
sqrt(k11_(m,j)×k11_(m,k)), for j=k,
since in the case j=k this would not be a cross-infection between groups, infection within any group j already being dealt with by k11_(m,j).
k11_(m,j) (and respectively for k11_(m,k)) values are the rates of infection per person from those in the respective I(m,j) (or I(m,k)) Incubation compartment to the respective U(j) (or U(k)) compartment within each group j (or k respectively) for variant m.
Infection rates k12_(m,j), k13_(m,j) and k14_(m,j), whose values are closely related to k11_(m,j), correspond to rates of infections per person per day to susceptible people in group j from the S(m,j), SS(m,j) and B(m,j) compartments, respectively, for each group j.
Cross-infection geometric mean rates k12(m,j,k), k13(m,j,k) and k14(m,j,k), for the compartments S(m,j), SS(m,j) and B(m,j), are defined as k11(m,j,k) was for I(m,j).
UK Population groups
Drawing upon the UK Population distribution I used in my April 14th post, I divide the UK susceptible population into four groups, as I did in that post – 1) active/younger; 2) care-givers/mid-life; 3) vulnerable/older/at risk; and 4) school-going youth. This allows the different susceptibilities of these groups to Covid-19 to be coded into the model to help analyse the sensitivities of potential outcomes, given different parametric inputs to a theoretical model.
Age and pre-existing health vulnerabilities are the clearest predictors of health outcomes from Covid-19 infections, and the UK Government’s NHS vaccination programme has therefore been prioritised across such population groups.
There are quite different outcomes for the four population groups defined in the model, with their different propensities to Covid-19 illness and mortality, and the UK vaccination programme is having a beneficial influence on these outcomes, as I showed in my last two blog posts.
Serious sickness and mortality by variant
fSS and fmort for each group had already been reset for model run UK957 in my April 14th post, to bring their averages across the population groups in that post into line with their values in previous model runs without group structure, for consistency and comparison purposes. In that work, however, I had chosen to leave fSS and fmort the same for all variants, with only the transmission rate k11 being different between variants, 70% higher for variant 2 (at 0.663) and double for variant 3 (at 0.78) compared with the original variant 1 (at 0.39).
I have now allowed fSS (the fraction of people becoming seriously sick from each variant) and fmort (fatality from infection by a variant) to vary for each Covid variant, and the new settings are as follows, with the changes principally affecting variant 3 in the principal comparative model runs for this post, UK928 and UK929. These specific variant settings for fSS and fmort, which differ by group as before, are shown on the individual group charts, but for the overall cumulative charts it is the weighted average across groups you will see for each variant. They are shown in full in the table below.
| Group | Description | % of UK population | v1 fSS | v1 fmort | v2 fSS | v2 fmort | v3 fSS | v3 fmort |
|---|---|---|---|---|---|---|---|---|
| 1 | Active/younger | 33.5% | 5% | .16% | 5% | .16% | 6.5% | .2% |
| 2 | Caregivers/mid-age | 30% | 12.6% | 1.17% | 12.6% | 1.17% | 16.4% | 1.52% |
| 3 | At risk | 17.5% | 25.2% | 6.26% | 25.2% | 6.26% | 32.8% | 8.14% |
| 4 | School-going | 19% | .63% | .004% | .63% | .004% | .82% | .0051% |
| All | Weighted average by % pop | 100% | 10% | 1.5% | 10% | 1.5% | 13% | 1.95% |
Vaccination efficacy by variant
Vaccination efficacy (vac_eff) in my April 14th blog post was the same for all variants, although can be different for each vaccination phase along with rate changes, which are shown in the vaccination settings table in that post.
Given the concerns about variants that might escape vaccines to some extent, I have now added a vaccination variant efficacy coefficient var_eff by variant, which multiplies the original vaccination efficacy vac_eff variable (per vaccination phase) by a coefficient between zero and 1, depending on that variant’s susceptibility (or not) to the vaccine.
The var_eff coefficient would take the value 1 if there were no degradation of the vaccine efficacy for that variant, but be between zero and 1 depending on how evasive the variant was assessed to be, with zero representing no vaccine efficacy for that variant.
The new vaccination table below shows the vac_eff and var_eff settings for the model in this post. I have set var_eff below 100% only for variant 3, at 70%. Any changes to variants 1 and 2 would have only taken effect once the vaccination period had started (January 1st 2021), of course, even though these variants were present in 2020, but these remain unchanged for this post.
| Model Day | Date from: | Vaccinations per day | Efficacy vac_eff | v1 var_eff | v2 var_eff | v3 var_eff | Groups included |
|---|---|---|---|---|---|---|---|
| 335 | January 1st | 300,000 | 70% | 100% | 100% | 70% | Group 3 at risk only |
| 366 | February 1st | 450,000 | 85% | 100% | 100% | 70% | Group 3 at risk only |
| 411 | March 18th | 500,000 | 85% | 100% | 100% | 70% | Groups 2 and 3 |
| 425 | April 1st | 300,000 (first doses) | 85% | 100% | 100% | 70% | Groups 2 and 3 |
| 455 | May 1st | 500,000 | 85% | 100% | 100% | 70% | Groups 2 and 3 |
| 486 | June 1st | 500,000 | 85% | 100% | 100% | 70% | Groups 1, 2 and 3 |
To help keep track of outputs on the charts, I have also labelled the variant identifiers on the charts with their fmort, fSS and var_eff percentage values.
As I said in the previous blog posts, accurate modelling is increasingly becoming a matter of sourcing the more disaggregated data for the model input parameters. These include: possible variations of vaccine efficacy vac_eff, as before; the group settings for mortality (fmort) and serious sickness propensity (fSS), also by variant; and the new vaccine variant efficacy (var_eff), by variant.
The vaccination starting dates and their rates are specific to the four population groups, with available daily vaccinations at each stage allocated on a per capita basis to the individuals in the groups included in that phase (of which there are six in the model runs for this post), as shown in the table above.
Infection transmission from vaccinated people
I remain convinced that vaccinated people can infect others. The topic was addressed back in September 2020 by Imperial College in their Report 33, and there is still much debate around it, also regarding the potential impact on “herd immunity”. Recent studies are beginning to identify evidence that vaccines do also reduce transmission to others, but not necessarily to the same degree as protection of the vaccine recipient. See my Discussion section later.
I covered aspects of this in my previous blog posts; in summary, the distinction has to do with the action of the different kinds of antibodies; immunoglobulin G (igG) antibodies act on internal organs (protecting the vaccinated person); and a different class of immunoglobulin A (igA) antibodies act in the nose, the throat, the lungs and digestive tract where the virus can settle, not impacting the vaccinated recipient, but potentially able to infect others via exhalations. See https://apple.news/ASfI1I9DvTkyaMwI3_tNXBg for more.
I have added a specific “vaccinated” transmissibility setting (vac_inf_prev) for each variant available in the model to allow me to model this, but hitherto have not used it, awaiting more certainty on the matter.
Variants under investigation (VuI) and Variants of Concern (VoC)
In this post I will show charts from model runs with fSS, fmort and var_eff adjusted for the putative variant 3 in the model (variant 3 could stand for the Brazil, South Africa or India variant, or any other). Any number of variants, arriving at different times, each with their own infection characteristics can be added to the model.
Variant 3 is introduced to the model on January 1st 2021, allowing analysis of 2021 outputs using that 2021 variant, rather than the September 2020 Variant 2 (the “Kent” variant), since the model is already fitted well for 2020, and the first two variants. Variant 2 was first detected on September 20th 2020, although not analysed and identified until well into November, as the WHO said, indicating the potential delay between arrival and identification.
The first variant 1 (that some call the “Wuhan” variant) is already declining by early 2021, the Kent variant 2 (with its up to 70% higher transmission rate) having become dominant. In this post I look at any potential changes to 2021 outcomes, now using variant 3 as a placeholder for any new Variant under Investigation (VuI) such as the “India” variant, or any Variant of Concern (VoC) such as the Brazil or South Africa variants, should they achieve higher growth rates. Surge testing has been under way in a number of UK postcodes to help avoid this eventuality. The UK Government site on VuIs and VoCs links to UK Government Technical Briefings on such variants.
Non-Pharmaceutical Interventions NPI
Non-Pharmaceutical Interventions (NPIs) and their change dates in the model correspond to step changes in the UK Government’s lockdown and easing measures, starting with the original lockdown on March 23rd 2020. Following the third lockdown on January 3rd 2021, there was a return to schools on March 7th 2021, and the England schedule below for further key 2021 dates is typical, although the NPI schedules are slightly different in the other UK home countries:

Model dataset UK929 has all the UK Government 2021 NPI relaxations already made, and planned. In model version UK928, for comparison purposes, the final data point for NPIs in the model is the lockdown on January 3rd 2021, with no subsequent 2021 NPI relaxations included.
The model NPIs are in some cases different for different groups; for example return to school affects predominantly school-age children. All NPIs are as shown here in my 14th April blog post. Although tabulated as averages over the four population groups, they can be, and in some cases are set individually for each group in the model. The zero NPI changes remain for easier comparison with my previous posts:
Model datasets
I keep all the data I might want to change in files separate from the main codes to make the changes easy to make and track, and this time I will show results principally for datasets UK929 and UK928.
Both datasets model the complete current and intended UK vaccination schedules by population group, as shown in the previous table. In addition, UK929 has the full set of 2021 NPI relaxations listed above, as far as we know them, and thus is the nearest to UK reality.
These new versions use similar assumptions to my previous posts. There are, for example, no vaccinations for school-age children (for which there is not yet regulatory approval).
Case UK928 differs only by excluding all 2021 NPI relaxations, so that we can see by comparison with UK929 the potential impact of those relaxations, always within the vaccination context.
We showed in our Nonlinear Dynamics paper submission, and I showed in my previous blog posts by comparing to NPI relaxation cases with no vaccination, that the vaccination programme has allowed the UK some opportunity for NPI relaxation. Comparing cases when vaccination is included for both, however, we saw that relaxing NPIs is not cost-free in terms of the Covid-19 health impact, and I show that again here for current UK data on vaccination and NPIs.
The models’ historical 2020 fit is quite good for both versions, being the same up until the end of 2020, with the fmort, fSS and var_eff changes only taking effect from January 1st 2021, for the third (and in principle for any required additional) variant.
Model charts
Appropriate version of charts 19 and 303 tell the overall story for all model settings. Just as for my previous two blog posts, there are also sets of charts 21-24 for model UK929 showing the comparative outcomes for the four population groups in the model, together with the cumulative totals shown in Chart 2. The direction of changes for the different groups and assumptions in the model seem sensible.
Previous case UK957 and new trial version UK927
For continuity with my previous blog post on April 14th, I will briefly compare the previous UK957 case from that post, for all 2021 NPI relaxations and full vaccination programme, to a new sensitivity trial model UK927 case, where I initially applied fmort and fss changes to the second (Kent) variant 2.
var_eff is applied to variant 3 in model UK927, since vaccination doesn’t start until January 1st 2021, when variant 3 is also introduced to the model.
This model UK927 shows, as expected, a depreciation in the the quality of the 2020 model UK957 fit to 2020 reported data, since variant 2‘s prior model parameters were already suitable to the real world 2020 outcomes.
It was this comparison that persuaded me, for this post, to confine such changes of fmort and fss, as well as var_eff, as stated above, to the January 1st 2021 third variant 3, which is more realistic, since any such new variant 3 effects would arise in 2021, and not affect the UK population in 2020, enabling me to explore outcomes for new 2021 variants without rewriting 2020 history.
To see Charts 19 for UK957 and UK927 below, slide the slider to switch between each to highlight the comparison clearly. Note the change of y-axis scale between the two charts, and the settings pertinent to each variant. Also note that there are six vaccination phases, Vac1 to Vac6, as for my previous two posts.
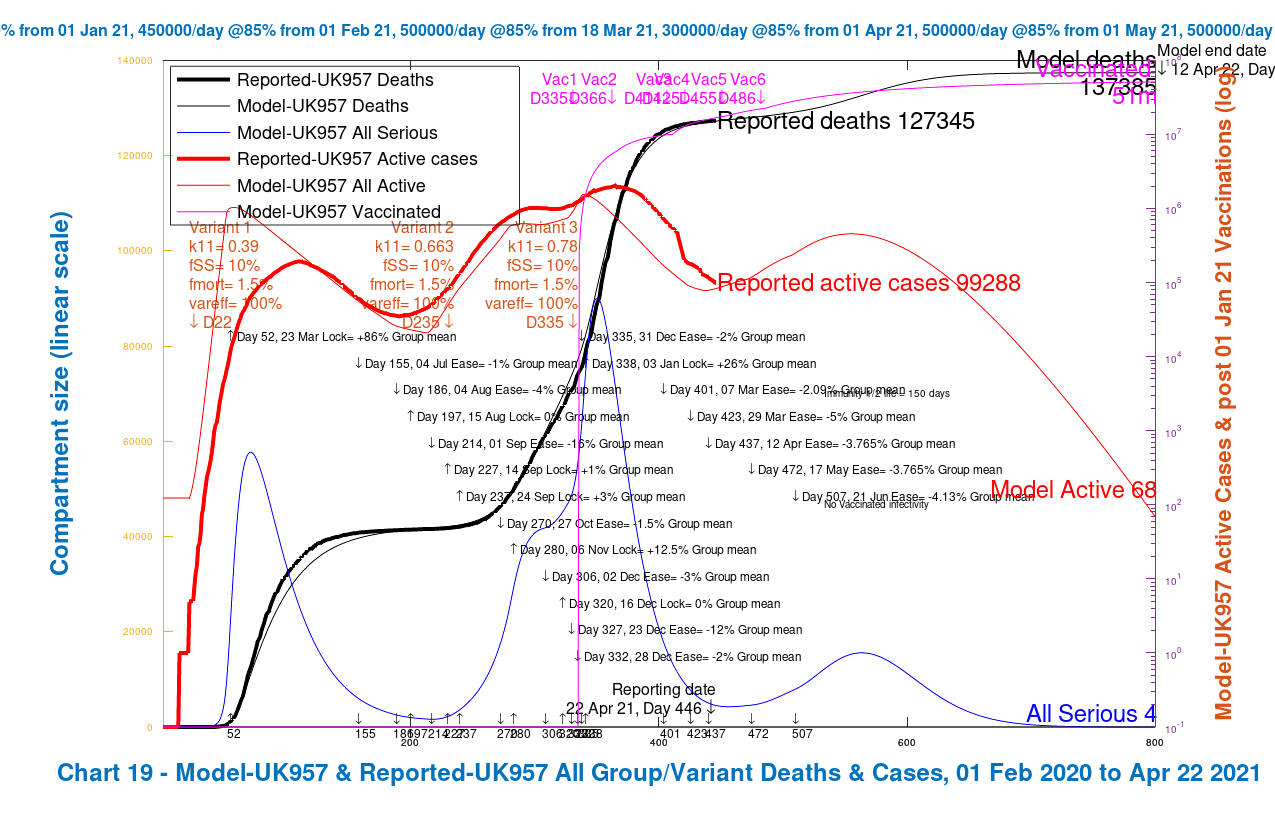

We see from the Chart 19 comparison that the good 2020 fit of reported and model outcomes for the UK957 chart diverges when applying the fmort and fSS settings to Variant 2 in model UK927. It also has the effect of increasing the projected deaths in the model to 145,389 at day 800, compared with 137,385 before, an increase of 8,004.
The Charts 303 for UK957 and UK927 below show the progress of each of the three variants, with their settings again shown on the charts, over the 800-day period. Similarly slide the slider to compare the two charts:


We see from the Chart 303 comparison the relative growth of variant 2 in the Spring and Summer of 2021, overtaking Variant 1 by early March 2021. Variant 3 has relatively less effect than Variant 2 in either model, even in UK927, despite its 70% var_eff setting in UK927, owing to its arrival in the model at a time when NPIs are high, and its lower fSS and fmort than those for Variant 2.
Group model charts for cases UK928 and UK929
In this section I apply the fmort and fSS changes to variant 3 instead of variant 2, which, as we see from the foregoing section, makes more sense. If variant 3 were in the UK shortly before the end of 2020, even with analysis and identification some weeks after its arrival, it would not have had significant effect until January 1st 2021 at the earliest, which is why I have introduced Variant 3 is to the model on that day.
Variant 2 (the “Kent” variant) was first swabbed on September 20th 2020. But according to the World Health Organisation (WHO) website “Retrospective analysis traced the first identified variant to Kent, South East England, on 20 September 2020, which was followed by a rapid increase of the same variant identified later in November“. This indicates the potential delay between arrival and confirmed detection of new variants. Variant 2 was not publicised until late November or early December 2020.
Firstly I will show similar Charts 19 and 303 as above, but this time comparing UK929, the case with 2021 NPI relaxations, with UK928, the case with no NPI relaxations, both versions in the context of the full UK vaccination programme. First, the two Chart 19s, sliding the slider to compare them as before. The rapid decline of the cases in UK928 with no NPI relaxations is in stark contrast to the bounce in active cases in UK929, with a concomitant effect on cumulative deaths.


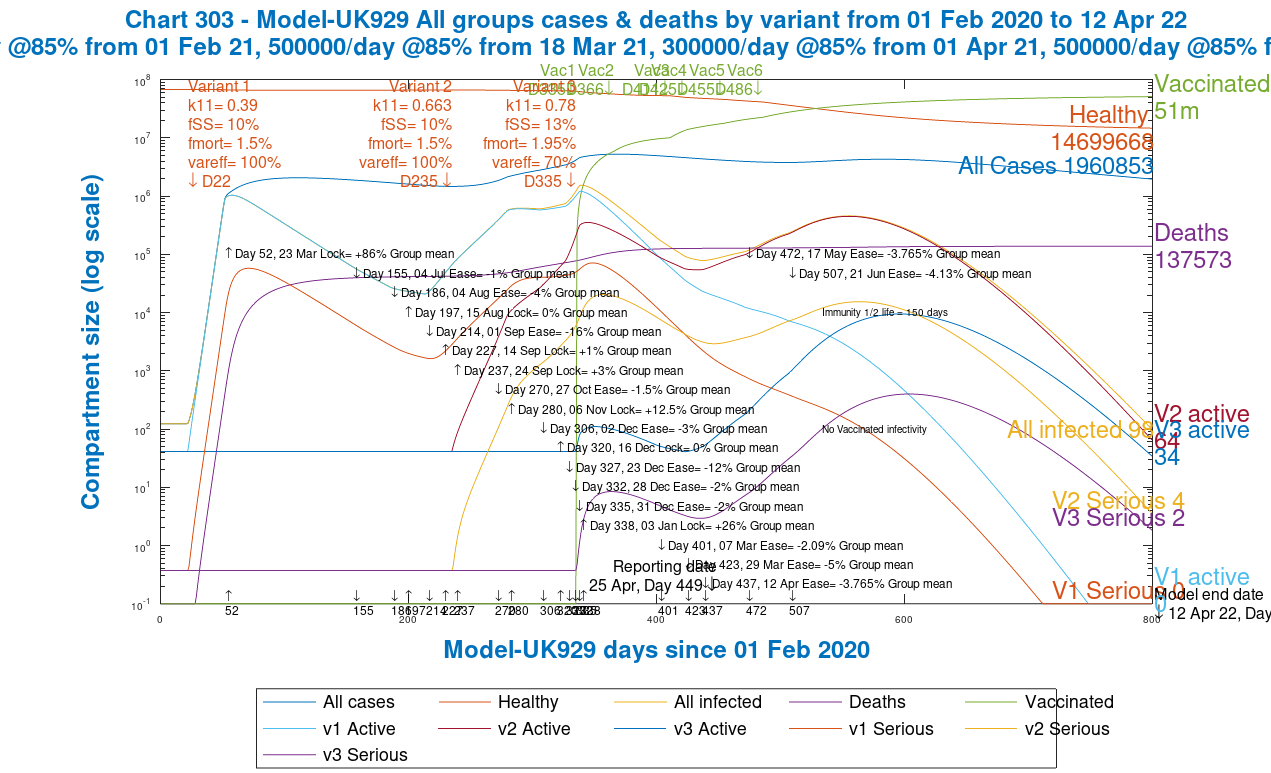
Similarly for Chart 303, which shows the progress of each variant separately.


We see from both sets of charts that deaths by Day 800, with NPI relaxations, are 137,573 compared with 127,514 without NPI relaxations, an increase of 10,059.
The difference is attributable to the relaxation of the NPIs in the model, and from Chart 303 we see the resulting bounce in Variant 2, and the growth of the putative variant 3, owing to its 30% increase in both mortality fmort and serious sickness proportion fss, as well as its lower 70% var_eff, which reduces the effect of the vaccine on it by 30%.
Both the first “Wuhan” variant 1, and the second “Kent” variant 2 then decline more quickly than variant 3 through the rest of 2021, although from a higher starting point in the case of variant 2, which remains the dominant variant for much of 2021.
Group charts for the mainstream case UK929
The last set of slides, just for the mainstream case UK929, which includes both vaccinations and NPI relaxations, reflecting our current situation in the UK, shows the differential outcomes for the four population groups after 800 days, at 12th April 2022, in Charts 21 to 24. Chart 2 is also included, showing the cumulative totals across all groups.
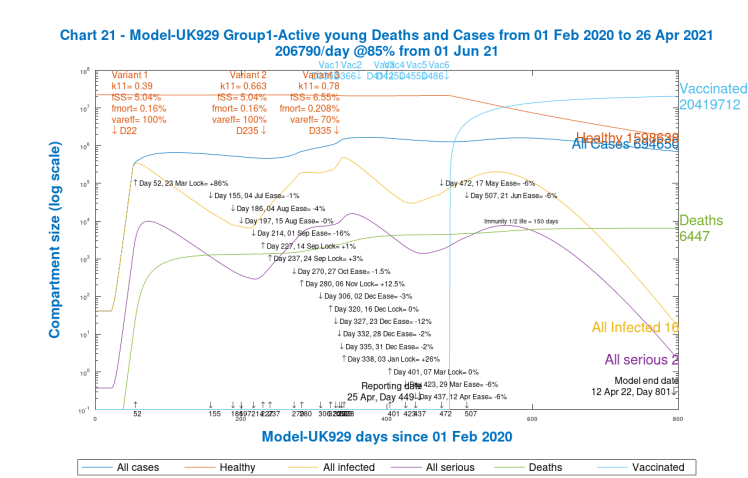
Chart 21, Group 1, Model UK 929. Active young Cases and Deaths 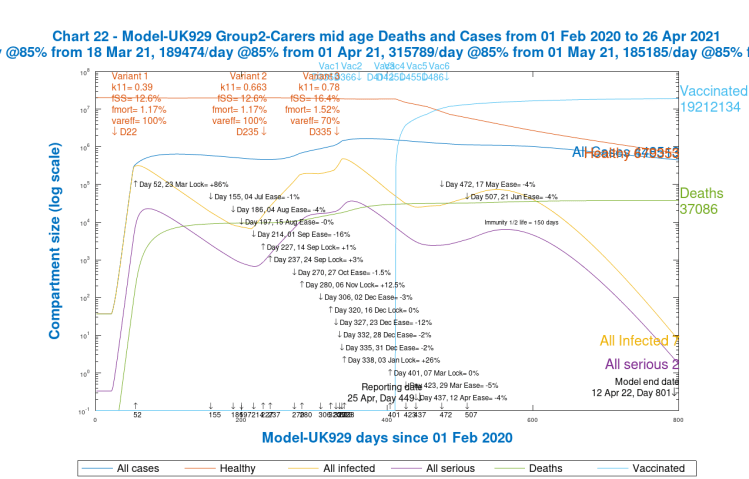
Chart 22, Group 2, Model UK 929. Carers and mid-age Cases and Deaths 
Chart 23, Group 3, Model 929. At Risk Cases and Deaths 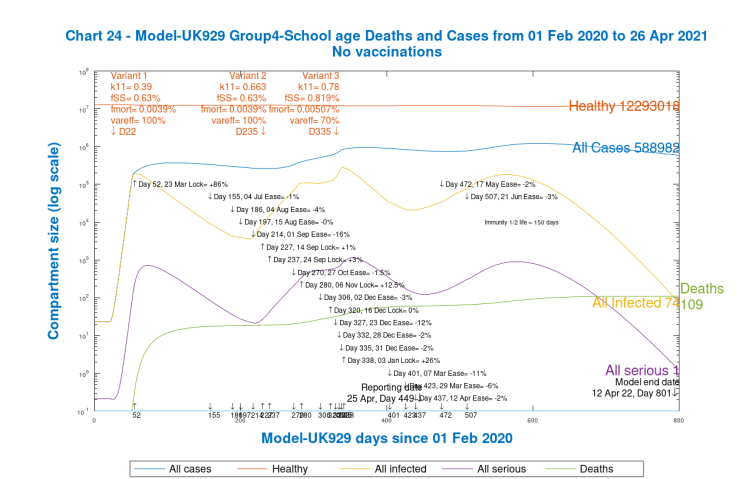
Chart 24, Group 4, Model 929. School age Cases and Deaths 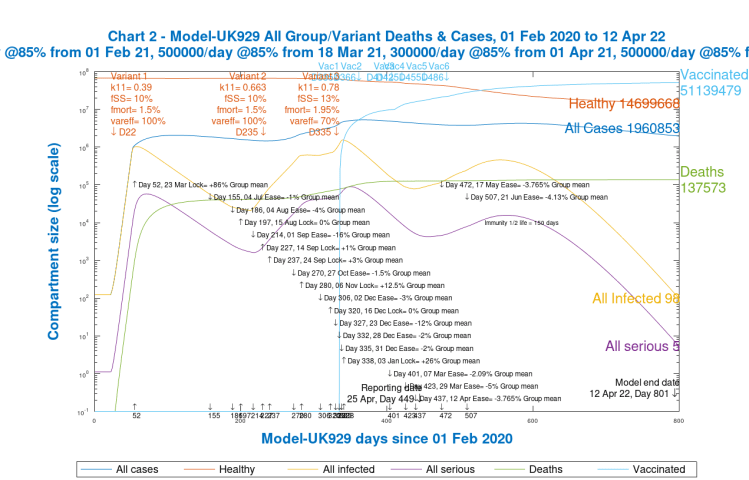
Chart 2, model UK 929. All groups and variant cases and deaths to 800 days
Notice that, as expected, deaths for school-age children are extremely low (and probably should be even lower to represent UK data exactly). It is striking that cases for children (Group 4) at 588,982 are not very different from those for Groups 1 and 2 for younger and mid-age people, 694,650 and 448,513 respectively.
Cases for the vulnerable/older Group 3 at 228,708, however, are much lower than for the other groups, but the higher mortality for this group means that deaths at 93,931 are much higher than 6,447 and 37,086 for Groups 1 and 2 respectively, and at a much higher death rate per capita than the other groups. These differences indicate why it is important to have the group capability in a model, better to understand and manage the outcomes of the pandemic. These 800 day outcomes are summarised below.
| Group | Description | % of UK population | Cases | Cases per capita | Deaths | Deaths per capita |
|---|---|---|---|---|---|---|
| 1 | Active/younger | 33.5% | 694650 | 3.06% | 6447 | .03% |
| 2 | Caregivers/mid-age | 30% | 448513 | 2.21% | 37086 | .18% |
| 3 | At risk | 17.5% | 228708 | 1.93% | 93931 | .79% |
| 4 | School-going | 19% | 588982 | 4.57% | 109 | .0008% |
| All | Weighted average by % population | 100% | 1960853 | 2.89% | 137573 | 0.2% |
The overall outcomes per capita look somewhat higher than in previous model runs, but recall that in order to explore the effect of potential new VoIs and VoCs, I have added a more infective and lethal third variant 3 into the mix, from January 1st 2021, with double the transmission rate k11 of variant 1, 30% higher fmort and fss, and with its var_eff value at 70%, representing 30% degradation in vaccine efficacy against it, compared with previous variants, which pushes up the 2021 rates of cases and deaths.
Discussion
Infectivity of vaccine recipients
Recent research on published data by Oxford University, for the UK Office for National Statistics (the ONS), shows that vaccination is taking the UK out of the pandemic, reducing it to epidemic status.
The data come from two studies that are part of the COVID-19 Infection Survey – a collaboration between Oxford University, the government’s health department, and the Office of National Statistics.
Both studies were published online as pre-prints on Friday 23rd April and are awaiting peer review.
One study, The impact of SARS-CoV-2 vaccines on antibody responses in the general population in the United Kingdom primarily concerned the levels of antibody response to vaccines, and concluded “Two doses achieved high responses across all ages, particularly increasing seroconversion in older people, to similar levels to those achieved after prior infection followed by a single dose. Antibody levels rose more slowly and to lower levels with Oxford-AstraZeneca vs Pfizer-BioNTech, but waned following a single Pfizer-BioNTech dose. Latent class models identified four responder phenotypes: older people, males, and those having long-term health conditions were more commonly ‘low responders’.“
The other study, Impact of vaccination on SARS-CoV-2 cases in the community: a population-based study using the UK’s COVID-19 Infection Survey, of particular interest regarding infection by vaccinated people, concluded “Vaccination with a single dose of Oxford-AstraZeneca or Pfizer-BioNTech vaccines, or two doses of Pfizer-BioNTech, significantly reduced new SARS-CoV-2 infections in this large community surveillance study. Greater reductions in symptomatic infections and/or infections with a higher viral burden are reflected in reduced rates of hospitalisations/deaths, but highlight the potential for limited ongoing transmission from asymptomatic infections in vaccinated individuals.“
Professor Sarah Walker, from the University of Oxford and chief investigator for the survey, believes it suggests that vaccines could slow transmission and are also effective against the Kent variant. She added she was “cautiously optimistic” the vaccine could be used to control the pandemic going forward, arguing that “lockdown isn’t a viable solution” in the long term and vaccines are “clearly going to be the only way that we are going to have a chance to control this long term“.
This live data analysis corroborates what my modelling has been telling me for months, and that Alex de Visscher’s, Tom Sutton’s and my joint paper reported, that vaccination is key to allowing us to relax NPIs without a massive increase in cases and deaths.
The conclusions on transmission from vaccinated people confirm, in principle, the September 2020 Imperial College Report 33 mentioned earlier (together with its Supplementary materials on modelling methodology for vaccines) which encourages me to pursue this as part of my next report.
Postscript: It has been widely reported, based on this press release from Public Health England on 28th April that transmission by vaccinated people in the home is reduced by 50%. The full research paper is on the PHE website here.
What if there were NPI reductions with no vaccination?
In my previous blog post on April 14th, I showed case UK954 for 2021 NPI relaxations without vaccination, and the model responded with runaway rates of growth for cases and deaths. I won’t repeat that here; as I said then, it is an unrealistic case in terms of prudent public policy, but it is available to view in Chart 303 in my April 14th blog post
Cyclical epidemic behaviour
My previous modelling tells me, as I reported in my October 19th blog post, and in my October 21st “Where’s the Exit” post, that without a pharmaceutical intervention – the vaccine – the pandemic can go into a cyclical mode as NPIs are eased when infections reduce, only for infections to rise, requiring NPIs to be increased again, a potentially repeating loop (as we have seen in the UK and elsewhere) which the UK Government now wishes to avoid, having encountered it during 2020.
This was something that was modelled independently by Imperial College, in their pivotal Report 9 on 16th March 2020, and also by the Harvard School of Public Health, as early as April 2020, when it was discussed in an online “Cambridge Conversation” in which I participated, and reported in my April 17th 2020 blog post; the relevant slide from that blog post, showing such modelling outcomes, can be seen here.
It inspired my later work to incorporate adaptively triggered NPIs, as an option, into my modelling. In such an adaptive model, NPIs are imposed and relaxed in response to actual and potential ICU bed occupancy. I used upper and lower bounds on the Seriously Sick numbers in my model as the criteria.
Vaccination in the UK has made a big difference, as we have seen both from modelling and from our recent experience. Such cyclical behaviour has been a modelled outcome in the absence of the option of pharmaceutical intervention.
We have seen several waves of infection, however, during 2020, in the absence of a vaccine. Should any further variants not be so susceptible to the vaccines that have been developed, it is to be hoped that Government won’t return to a “boom and bust” approach to NPI imposition and relaxation, leading to significant waves of infection and deaths.
Differences in group outcomes
The differential group model UK929 charts above show that infection case rates are driven mainly by younger, mid-age people and children (Groups 1, 2 and 4) and death rates are driven mainly by the vulnerable and older parts of the population (Group 3 in the model). Despite their high number of cases, children of school age (Group 4) comprise a tiny fraction of the deaths.
In the model, of course, these outcomes are rooted in the data used for infection rates and mortality for people in these groups, for the different variants in the model. Over the course of my last three blog posts I can now reflect in the model the different characteristics of the population groups. My latest work, reported in this blog post, allows me to also set more specific infection parameters of any new variants that might come along, allowing outcomes to be well differentiated.
Next steps
At some point politicians have to decide how life will resume in terms of economic and social activity, including domestic and international travel. The health costs of NPI relaxation indicated by my modelling do show how important lockdown has been.
Now that we have a successful UK vaccination programme helping to ameliorate the pandemic’s effects, which without such a vaccination regime are dire, decision-makers will need to look at the relative health and other costs of relaxing different aspects of lockdown, the NPIs.
NHS waiting lists in the UK have increased, and mental as well as physical health issues have to some extent gone undiagnosed and untreated for a long time during the lockdown phases of the pandemic.
Some academics and other advisers are modelling the pandemic in a broader health and economic framework for just these reasons. As time passes, the targets are moving: on the one hand, the longer the pandemic lasts, the more variants develop; and on the other hand, medical science makes progress with vaccines and other treatments.
The incidence of variants in the context of population vaccination is not a dependency – the SARS-Cov-2 virus doesn’t know that we have vaccines, and variants aren’t “designed” to escape vaccines. It’s more a Darwinian “survival of the fittest”. Random variant mutations that happen to be resistant to our vaccines will survive longer, multiply faster and become dominant over other less well-adapted variants (as, for different reasons, the “Kent” variant has become dominant in the UK so far), and so the faster we bring the pandemic to lower levels of infection, the less time and opportunity there is for such variants to develop.
As for my own work, I will focus on the data-gathering, mathematical and programming challenges of refining this group model. Data is probably the greatest challenge of those three at the moment, since model functionality is looking good; I will be working on refining those parameters that I have talked about in the blog post, and more.

4 thoughts on “Exploring new Coronavirus variants, vaccines and NPIs”