
Summary
There has been increasing concern recently about a SARS-Cov-2 variant from India (now denoted Variant of Concern VOC-21APR-02 in the UK Government’s variant database) that as well as having a higher transmission rate (as much as 50% more than that of the Kent variant) might escape vaccines to some extent, and/or be more virulent, causing greater severity of illness with higher mortality.
There are some specific council areas in the UK, including Bolton in England, and Pollockshields in the south of Glasgow, for example, where there are hotspot infections from this India variant. The total in the UK at present is in the low thousands overall, although growing.
Hospitalisations are currently low, but NPI relaxations have been delayed or reduced in some such places as a response. In Scotland, Glasgow remains in Tier 3 while most of the rest of the Scottish mainland is in the lower Tier 2 of restrictions, with the Western Isles in Tier 1. Hence travel into Glasgow from outside is only allowed for defined essential purposes.
Government is clearly worried, and some scientific advisers have reportedly suggested more caution about the current and planned NPI (Non-Pharmaceutical Intervention) relaxation regime.
What might pandemic advisers be seeing and highlighting to decision-makers in Government?
I have developed some model scenarios that show examples of what might be behind such expert advice. The scenarios also indicate the importance of the UK vaccine programme, as we face variants with potentially different characteristics of transmission, severity of infection and responsiveness to vaccines.
Introduction
I have demonstrated before in my blog posts, most recently on April 23rd and April 14th, that the UK vaccination programme is fundamental to allowing any lockdown relaxations. Charts for scenarios without vaccination show a runaway situation if lockdown relaxations were to go ahead in the absence of an effective vaccination programme.
In the April 14th post, I was tuning my UK Coronavirus model based on Prof Alex de Visscher‘s original work on a grouped Covid-19 pandemic model. Our work on this model, with a UK case-example, was submitted as a paper with Dr Tom Sutton on January 31st to the Springer journal Nonlinear Dynamics, and is currently available at Research Square, in review. This work also confirmed the importance of vaccination in supporting NPI relaxation.
All my codes are based on an original code from early 2020 developed by Alex at Concordia University in Montreal, with whom Tom and I have been working to develop model extensions for the UK.
For this post I am using my original single group model, focusing more on variants and their vaccine susceptibility than on sub-population groups.
Vaccination schedule
My earlier work with Alex and Tom and our paper confirmed the significant opportunity offered by a vaccination campaign to allow a degree of lockdown easing, through relaxing some NPIs.
Any realistic epidemiological models for the UK must include, therefore, the continuing successful UK vaccination programme, and this is the case in all the charts that follow.
Current vaccination progress in the UK is reported in the following chart from the UK Government Coronavirus website:

The vaccination programme in the model is in 6 phases, starting at 70% vaccine efficacy (vac_eff in the model) during January 2021, with remaining phases at 85% efficacy. The rate of vaccination delivery varies between 300k/day and 500k/day, depending on the phase, matching the UK rollout of vaccination. For vaccination in the model phase 4 starting on April 2021, for example, I reduce the delivery rate to 300k/day to reflect the UK’s reduced vaccine supply situation and the lower first vaccination rate (in favour of second vaccinations).
In the model runs for this post, as I did in my April 23rd post, I use a vaccination efficacy multiplier (“coefficient”) var_eff by variant, to allow me to explore the potential for a variant, in these scenarios variant 3, to “escape” the vaccines to some extent.
| Model Day | Date from: | Vaccinations per day | Efficacy vac_eff | v1 var_eff | v2 var_eff | v3 var_eff |
|---|---|---|---|---|---|---|
| 335 | January 1st | 300,000 | 70% | 100% | 100% | 70% or 100% |
| 366 | February 1st | 450,000 | 85% | 100% | 100% | 70% or 100% |
| 411 | March 18th | 500,000 | 85% | 100% | 100% | 70% or 100% |
| 425 | April 1st | 300,000 (first doses) | 85% | 100% | 100% | 70% or 100% |
| 455 | May 1st | 500,000 | 85% | 100% | 100% | 70% or 100% |
| 486 | June 1st | 500,000 | 85% | 100% | 100% | 70% or 100% |
I will show scenarios with 100% and 70% settings for var_eff for Variant 3, which I introduce to the model on January 1st 2021. For example, if vac_eff were 85% and the coefficient var_eff for variant 3 were 70%, then the overall efficacy of vaccines against variant 3 in that model scenario would be (.85×.70)% ≈ 60%.
Vaccine hesitancy
Incidentally, this helps highlight the importance of as many people as possible taking the vaccine when offered. If overall vaccine efficacy were even as high at 85%, after assuming zero variant non-compliance (var_eff = 100%), and only – say – 85% of the population take it, we are already as low as (.85×.85)×100% ≈ 72% population protection against variant 3.
This is already very close to the community immunity percentage required for the original strain of SARS-Cov-2 in the UK. Even for an R0 ≈ 2.5 to 4, for the original strain, 72% is too close to the threshold for community immunity for comfort, let alone for variant 3 with transmission rate (and therefore an R0) of possibly ~2.5 times that of the original variant.
I covered the calculations behind this a year ago in my June 28th blog post, following up in my 23rd December post as follows, when talking about the “Kent” variant (which is variant 2 in the present blog post). I insert [comments] for clarity:
“For this new [Kent] strain [v2], whose transmission rate is assumed to be 70% higher than the original [v1], the R0 value will be correspondingly 70% higher (virulence assumed to be the same) and so the range of R0 I have used in previous explanations of community immunity (aka herd immunity), for example in my June 28th blog post, where I discuss it in detail, the R0 of 2.5 to 4 would be increased to an R0 of about 4 to 6.5 for the new variant [v2].
“Thus the range of herd immunity % requirement for the new variant virus [v2], given by H% = (1-1/R0)x100% becomes, instead of a range 60% to 75%, something more like 75% to 85%.“
For variant 3, the subject of this present post, with transmission rate ~2.5 times that of variant 1 and 50% more than variant 2, we might be talking about a reproduction number in the range 6 ≤ R0 ≤ 10 and thus the community immunity requirement H% = (1-1/R0)x100% would become a range of 83% ≤ H ≤ 90% if variant 3 were to become dominant.
Hence I have concerns about “vaccine hesitancy” – a euphemism, in my view, for behaviour (except where medically justified) that threatens public health, not just that of the refuser.
Non-Pharmaceutical Interventions (NPIs)
We shall see again the importance of good vaccine efficacy against variant 3. In scenarios where the variant 3 var_eff is 70%, the model shows steeply increasing cases and deaths, starting towards the end of the NPI relaxation programme.
My previous work has also indicated how important NPIs have been in controlling the pandemic, especially before vaccines were approved for use, but also as vaccination has ramped up. Even with the vaccination programme now well developed, NPIs remain an important tool in guarding against a variant that might escape vaccines to some extent.
In previous posts I have shown that if NPIs are not reduced, then the pandemic in the UK is much more controlled, even in the absence of vaccination.
But for economic, social and other health reasons, including mental health, vaccines offer the opportunity to reduce the negative impacts of lockdown that we have seen in these areas. The current NPI 2021 relaxation schedule in England is as follows, paralleled by similar measures in the other UK home countries. It is reflected in the model settings for 2021. All model NPIs may be seen tabulated in all of the charts, by date and % uplift or reduction accordingly.

Model settings summary
In all model runs for this post, variant 3 (from January 1st 2021) has 50% more transmission (k11 in the model) than (the Kent) variant 2 (as is widely feared about the India variant), and ~2.5 times that of variant 1 (that some call the Wuhan variant).
We will see that in scenarios where var_eff for variant 3 is 100%, so that the relative vaccine efficacy for variant 3 compared with that for earlier variants is the same, even increasing the propensity to serious illness, fss, and mortality fmort of variant 3 by 30% in the model doesn’t have a material effect. The vaccine is in charge in such scenarios.
Variant settings for the four scenarios I have included are as follows:
| Model scenario | v1 k11 | v2 k11 | v3 k11 | v1/v2 fSS | v1/v2 fmort | v3 fSS | v3 fmort | v1/v2 var_eff | v3 var_eff |
|---|---|---|---|---|---|---|---|---|---|
| UK433 | .39 | .663 | 1.0 | 10% | 1.5% | 10% | 1.5% | 100% | 70% |
| UK429 | .39 | .663 | 1.0 | 10% | 1.5% | 10% | 1.5% | 100% | 100% |
| UK439 | .39 | .663 | 1.0 | 10% | 1.5% | 13% | 1.95% | 100% | 100% |
| UK443 | .39 | .663 | 1.0 | 10% | 1.5% | 13% | 1.95% | 100% | 70% |
All model runs are from my original single population UK model code (where the model’s fit to reported data history is excellent) which I have continued to extend, to allow more variant parameters to be adjusted.
These parameters include the propensity of the variant to cause serious sickness, fss and its mortality fmort, as in recent posts; and now the new var_eff compliance coefficient, set for variant 3 in this post at either 70% or 100%, which modifies the vaccination effectiveness vac_eff.
Vaccine efficacy vac_eff, as in the Vaccination table above, is set at 70% for Vaccination phase 1 (during January 2021), and at 85% for the later five vaccination phases, from February 1st onwards.
Charts
Following the first chart 207, showing the the public reported data for total cases, active cases and deaths, I will show just three charts for the model simulations, which between them show the fit to public reported data for cases and deaths, to date (May 23rd 2021) and the way in which the three variants grow (and decline) over the 800 day simulation period.
Chart 207 – public reported data
Notice on chart 207 how reported active cases have declined from their recent peak in early 2021, but with the rate of decline in the last few weeks having plateaued. Given that UK vaccination numbers are increasing through early 2021, I can only think that this reduction in the rate of decline is a result of both the early 2021 relaxations of NPIs, matched by some behavioural relaxation in public compliance with social distancing and other measures.
Some other early public data indicate, however, that variant 3 hospitalisations are not at a greater rate than for previous variants, and we also see on the chart the plateau in deaths from Covid-19, which have been running at single digit numbers per day for the UK recently.

Chart 19 – overall historic fit and projections
The following charts show how reduced compliance of a variant to vaccines can influence outcomes. Remember that vaccines don’t protect everyone that receive them – vaccine efficacy vac_eff is set at 85% for most vaccination phases in the model. So even when the variant vaccine compliance coefficient is set at 100%, the population is only protected to that 85% vaccine efficacy level.
var_eff = 70% variant 3 compliance to vaccines
As I mentioned above, when the variant compliance is 70% for variant 3, the protection of people from this variant is only at (.85×.70)×100% ≈ 60% in most vaccination phases, except in the January phase, when it is (.70×.70)×100% ≈ 50%.
The first Chart 19 shows the overall deaths and active cases in scenarios UK433 and UK443, in a two-slide slideshow, for which var_eff for variant 3 is set at 70%, representing a 30% reduction in vaccine effectiveness against variant 3 compared with previous variants. The two scenarios differ only with the fss, and fmort settings for variant 3, being 30% higher in the UK443 scenario, representing more serious illness and mortality from variant 3 compared with scenario UK433.

Chart 19 for scenario UK433: v3 transmission k11 = 1, var_eff = 100%. Modelled 800 day outcomes to April 12th 2022 compared with reported active cases and deaths to May 23rd, with 2021 NPI relaxations up to June 21st 2021. 
Chart 19 for scenario UK443: v3 transmission k11 = 1, var_eff = 100%. Modelled 800 day outcomes to April 12th 2022 compared with reported active cases and deaths to May 23rd, with 2021 NPI relaxations up to June 21st 2021.
The model’s fit to reported deaths to May 23rd is virtually exact (the heavier and thin black curves), and modelled and reported active cases (heavier and thin red curves) are quite close, especially bearing in mind that reporting of Covid-19 cases has been much less accurate than reporting of deaths over the last year.
The notable thing to see here is the sudden growth in the modelled active cases (the red curve) just after the final NPI relaxation date of June 21st, followed by increases in serious cases (in blue) and the death rate (in black).
As between the two scenarios, we see nearly a 100,000 increase in deaths over 800 days, which must arise from the only difference in the two models, the 30% higher fss, and fmort settings in scenario UK443 compared with UK433.
These are not forecasts, because I am sure that remedial action would be taken if signs of any such growth were to be seen in practice. But as this and my previous posts have shown, it highlights how important it is to act early in (re-)applying NPIs to forestall such virus growth, as soon the first signs are seen.
var_eff = 100% variant 3 compliance to vaccine
We see very different outcomes for the following scenarios, where the var_eff setting for both scenarios is 100% – i.e. the vaccines are equally effective for variant 3 as for the previous two variants. In these scenarios, the overall vaccine efficacy for people is (.85×1.0)×100% = 85% in all vaccination phases except the first month, when it is (.7×1.0)×100% = 70%.
The two scenarios are UK429 and UK439, as shown here:

Chart 19 for scenario UK429: v3 transmission k11 = 1, var_eff = 100%. Modelled 800 day outcomes to April 12th 2022 compared with reported active cases and deaths to May 23rd, with 2021 NPI relaxations up to June 21st 2021. 
Chart 19 for scenario UK439: v3 transmission k11 = 1, var_eff = 100%. Modelled 800 day outcomes to April 12th 2022 compared with reported active cases and deaths to May 23rd, with 2021 NPI relaxations up to June 21st 2021.
In these scenarios we see virtually no difference in the outcomes even though fss, and fmort are increased by 30% in model UK439 compared with UK429. Since this is the only difference between the scenarios, it confirms that a highly effective vaccine (which has vac_eff at 85% for all but the first vaccination phase in January, when it is 70%) controls the model’s otherwise more infective and virulent variant 3 in these two scenarios, which has 50% higher transmission than variant 2 – the “Kent” variant – and ~2.5 times that of the original variant 1.
The next charts 303 will show in more detail how the different variants contribute to these overall outcomes.
Chart 303 – All variants’ growth and decline, log y-axis
Charts 303 (log y-axis) for models UK433 and UK443 with var_eff = 70% show variant 3 becoming dominant into 2021, variant 2 (the Kent variant) having been dominant around the end of 2020. Variant 1 is in steep decline from the beginning of 2021, when the third UK lockdown started on January 3rd (Day 338 in the model).

Chart 303 for scenario UK433: v3 transmission k11 = 1, var_eff = 100%. Modelled 800 day outcomes to April 12th 2022. Serious cases and deaths for all variants, with 2021 NPI relaxations up to June 21st 2021. 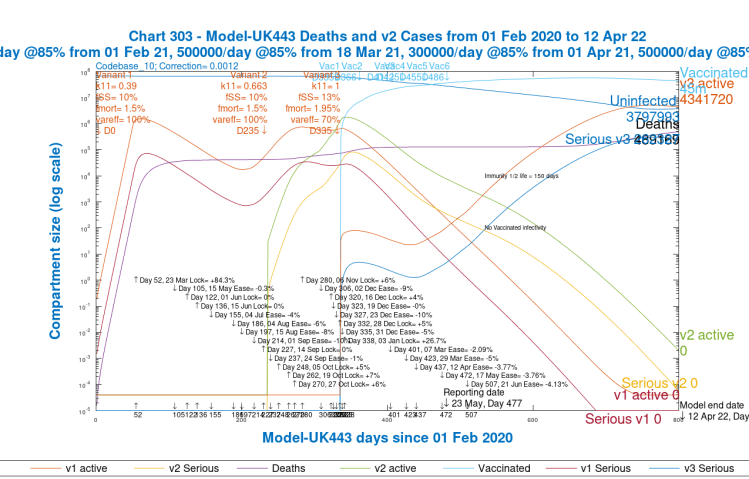
Chart 303 for scenario UK443: v3 transmission k11 = 1, var_eff = 100%. Modelled 800 day outcomes to April 12th 2022. Serious cases and deaths for all variants, with 2021 NPI relaxations up to June 21st 2021.
As we saw in Charts 19 above, we get a much more controlled picture for scenarios UK429 and UK 439 below, where var_eff for variant 3 is 100%, representing identical vaccine efficacy against variant 3 as for the previous variants:

Chart 303 for scenario UK429: v3 transmission k11 = 1, var_eff = 100%. Modelled 800 day outcomes to April 12th 2022. Serious cases and deaths for all variants, with 2021 NPI relaxations up to June 21st 2021. 
Chart 303 for scenario UK439: v3 transmission k11 = 1, var_eff = 100%. Modelled 800 day outcomes to April 12th 2022. Serious cases and deaths for all variants, with 2021 NPI relaxations up to June 21st 2021.
We see again that these two scenarios UK429 and UK 439 are nearly identical, with variant 1 causing 2020 waves, variant 2 peaking in late 2020 to early 2021, and variant 3 not getting started at all, hardly rising above its “seeding” settings in the model.
This is owing to the only difference between these two scenarios and scenarios UK433 and UK443 before; the 100% var_eff setting, representing just as high vaccine efficacy against the third variant as for the previous ones.
Chart 18 – Variant growth and decline, linear y-axis
Charts 18 for scenarios UK433 and UK443 show the serious cases caused by the three variants separately on linear charts (plotted against the left y-axis). The right hand log y-axis is for the large number of vaccinations (the red curve, 45 million successful vaccinations by Day 800 for these two scenarios).

Chart 18 for scenario UK433: v3 transmission k11 = 1, var_eff = 70%. Modelled 800 day outcomes to April 12th 2022 compared with reported deaths to May 23rd. Serious cases for all variants, with 2021 NPI relaxations up to June 21st 2021. 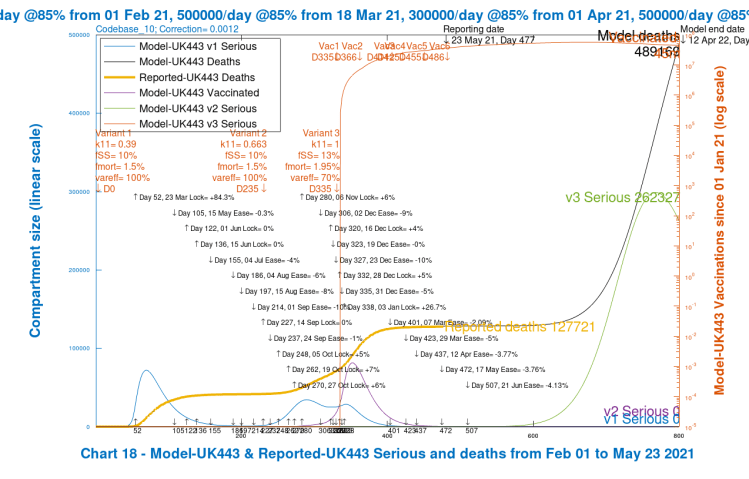
Chart 18 for scenario UK443: v3 transmission k11 = 1, var_eff = 70%. Modelled 800 day outcomes to April 12th 2022 compared with reported deaths to May 23rd. Serious cases for all variants, with 2021 NPI relaxations up to June 21st 2021.
As before, I think these are almost certainly overestimates in practice, but they show the variant detail of the high growth in cases and deaths as for the charts 19 and 303 before. Scenario UK443 with 30% higher fSS and fmort for variant 3 show the higher growth in serious cases for variant 3 after the NPI relaxation programme than in scenario UK433, but they are both very high.
Plotting charts 18 for scenarios UK429 and UK439 instead, where var_eff at 100% is the same for variant 3 as for previous variants, we again see stability restored, even though the fSS and fmort settings are 30% higher for the UK439 scenario than for UK429. Day-800 cumulative successful vaccinations are at 63 million (the red curve) in these two scenarios.
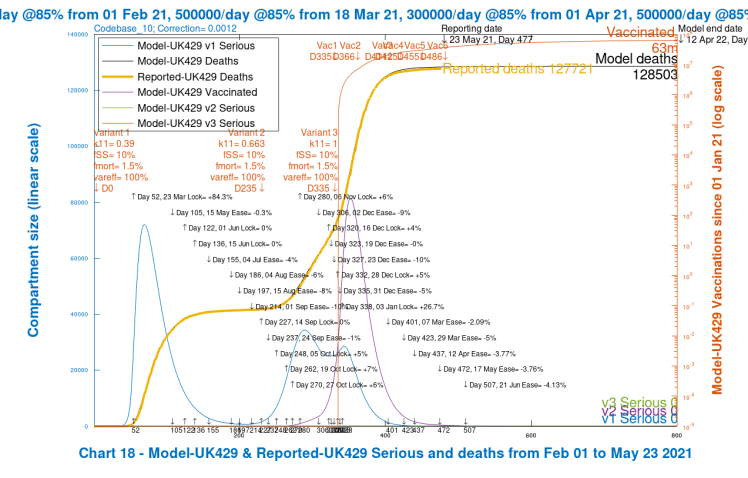
Chart 18 for scenario UK429: v3 transmission k11 = 1, var_eff = 70%. Modelled 800 day outcomes to April 12th 2022 compared with reported deaths to May 23rd. Serious cases for all variants, with 2021 NPI relaxations up to June 21st 2021. 
Chart 18 for scenario UK439: v3 transmission k11 = 1, var_eff = 70%. Modelled 800 day outcomes to April 12th 2022 compared with reported deaths to May 23rd. Serious cases for all variants, with 2021 NPI relaxations up to June 21st 2021.
Discussion
I guess that UK government advisers’ modelling might be showing such effects for a highly transmissive, and possibly more virulent and vaccine resistant variant such as variant 3 following the planned NPI relaxation schedule.
The final NPI relaxation is scheduled for June 21st (when Government hope to remove all legal restrictions, apparently somewhat against some scientists’ advice), when some scenarios, with lower overall vaccine efficacy for variant 3 (UK433 and UK443) show active and serious cases quickly increasing. The scientists, and apparently the Prime Minister agrees, think that we need more data.
As I write this post, a study is reported by Public Health Engand (PHE) which indicates (although these are early results) good vaccine efficacy against the India variant (equivalent to my model variant 3). One press report of this work shows the following table:

I hope, therefore, that outcomes will be much nearer to my scenarios UK439 and UK429, with 100% variant compliance var_eff, than to scenarios UK433 and UK443 with 70% var_eff for variant 3.
Reported scientific and Government concerns about new variants would be explained by something like the growth effects we see in the model scenarios where effective vaccine efficacy (vac_eff x var_eff) is 30% lower against variant 3. Even though current India variant infections are quite low in the UK, maybe Government is seeing huge growth later on, like this, in some scenarios in their own advisers’ modelling?
Being sure of the relevant variant data on infectivity, virulence and vaccine efficacy is quite difficult at the moment. There are three India variants on the UK Government list, each with somewhat different characteristics, with VOC-21APR-02 the one of immediate concern, but the others under investigation. Of those recent variants on the list, there is also a March Variant under Investigation (VUI-21MAR-02) from the Philippines, and another in May whose source is yet to be confirmed.

The UK does have the advantage of a strong genomic sequencing capability, and much more is known this year than a year ago about who in the UK is suffering from which Covid-19 variants. But these are early days with the latest variant(s), and data is relatively sparse so far.
Second-guessing Government and its advisers is interesting. It’s why I started modelling the pandemic in the first place, in March 2020. Information about data and scientific advice then was hard to source, but there is much more now, including from other commentators, including the Independent Sage group who purport to offer alternative views to the official Government advice group SAGE (The Scientific Advisory Group for Emergencies).
A key aspect is the modelling of the relative effectiveness of the many different NPIs that can be deployed – social distancing, working from home, travel restrictions, school closures, shielding of vulnerable people and many others.
I am particularly interested in the modelling work of two subgroups to SAGE. Firstly, the SPi-M (The Scientific Pandemic Influenza Subgroup on Modelling) where I follow the work of Imperial College and the London School of Hygiene and Tropical Medicine, and others, who sit on that Subgroup.
There is a second Subgroup, the SPi-B (Scientific Pandemic Insights Group on Behaviours) whose role is to provide behavioural science advice aimed at anticipating and helping people adhere to interventions (both pharmaceutical and non-pharmaceutical) that are recommended by medical or epidemiological experts.
The NPIs I have mentioned above are only as good as the extent to which people will follow them, and to some extent this increases the difficulty that I mentioned of estimating their effect. So this behavioural work is important too.
There is also the issue of how vulnerable different parts of the population, differentiated by age and pre-existing vulnerabilities, are to the different variants, which I explored with my group model in my April 23rd blog post.
For those reasons my work, rather than a definitive forecast, is more an indication of the direction of potential changes in the pandemic resulting from putative changes that might be made to these many different parameters.
Conclusion
It is reassuring that PHE (Public Health England) evidence from emerging studies seems to suggest that the India variant does not escape the vaccines significantly more than previous variants. There are, and will be other random mutations of the SARS-Cov-2 virus, however, and models like this can help look at the potential effects of the presumed or observed characteristics of such new variants.
Once again, my work confirms unequivocally the pivotal role that the vaccine programme plays in controlling pandemic growth while we manage NPIs down to allow the economy, social interactions and travel to return nearer to normal, along with recovery of the pre-pandemic range of wider health services deployment.

2 thoughts on “Why the UK Government is worried about new Coronavirus variants”