Summary
This is an update to my most recent post on June 6th, a detailed analysis of the many options for the UK lockdown easing originally planned for June 21st. The UK Government eventually decided to delay to July 19th (one of the options I considered), with some collateral advice about maintaining some precautions, but with no legal restrictions.
In this post, I will show some results from a development of my model which includes immunity waning (at 150 days half-life), vaccine hesitancy by group (generally anti-correlated with age), multiple vaccine inoculations (representing up to the typical two jabs required by most vaccines for best immunity) and also the possibility of vaccinated people not only becoming infected, but also of passing on the virus, even if not infected themselves.
Introduction
I shall present projections for just four scenarios (for the July 19th lockdown easing) but with some adjustment of the Non-Pharmaceutical Intervention (NPI) easing settings for both July 19th (average -1% across population groups instead of -2%) and also for the prior NPIs on May 17th (-1.9% instead of -3.8%).
This reflects what most professional modellers have observed with some surprise, which is that the NPI easings made on those dates have had much less effect than they had expected. Most have ascribed this to the effect of the vaccination programme, to some extent decoupling (for some parts of the population) the links between cases, hospitalisations and deaths.
The four scenarios I present will range over high and low settings for virulence (fSS) of the Delta variant (v3 in the model), and high and low settings for vaccine efficacy (var_eff) against v3 compared with that for the the original variant v1, and v2 (the Alpha variant). I have also made additional reductions in all four scenarios for fSS and the mortality fMORT for vaccinated people, larger reductions for double vaccinated people, less so for single vaccinated people shown in the table below.
Models (including mine, which also includes age and vulnerability dependency) and reported data have shown that the growth in cases in 2021 is much more marked for the younger, less-vaccinated parts of the population, resulting in a lower overall death rate as a proportion of cases, owing to the greater overall resilience against infections of the younger cohort of cases. As before in my models, fSS and fMORT vary between the age/vulnerability groups, as can be seen in the table below.
I think that another reason that “Freedom Day” has not has the severe impact that some were fearing is that large parts of our population have become habitually more cautious about Covid-19. The press, who want to sell newspapers, tend to cover the more newsworthy behavioural excesses, but at the same time many of us note the more serious Covid-19 outcomes, and take more care.
I think that many will continue with some of the simpler behavioural precautions and hygiene procedures which also help with avoiding other types of infections, including seasonal influenza. We should see Government pandemic mitigations through the public behaviour lens to understand their effect.
My June 6th model projections
My June 6th post considered a dozen options for the June 21st lockdown easing decision, embracing reduced levels of lockdown easing (including no easing), and delay options of 14, 28 and 56 days for each.
In the event, the Government chose to delay by 28 days to July 19th. The projections of one of my combined reduced and delay options, Option G, with a -2% reduction in NPIs on July 19th, has remained fairly well on-track with the progress of the pandemic in the UK. In this tabular extract from that June 6th blog post, I compare the impact of Option G on long term deaths with the original plan, represented by my Option B.
| Option | % NPIs | Delay | Base scenario deaths 70% v3 var_eff | With v3 vir/mort 30% lower | 100% of v1/v2 vaccine efficacy var_eff | With both v3 changes | Average | Average % saving of lives against Option B |
|---|---|---|---|---|---|---|---|---|
| B June 21st | -4% | none | 192,348 | 178,330 | 166,104 | 158,241 | 173,756 | – |
| G July 19th | -2% | 28 days | 167,840 | 159,229 | 147,830 | 143,923 | 154,706 | -10.96% |
In graphical form, the Option G projections as published in that blog post show the following comparisons with published data for active cases and deaths at June 6th, for 4 different assumptions about the Delta variant v3‘s virulence, mortality and susceptibility to vaccines compared with earlier variants, as shown in red in the body of the charts in the three Variant parameter lists. The var_eff multiplier (100% or 70%) for the vaccine efficacy against the Delta variant v3 had the greater effect on the outcomes, compared with the 30% virulence fSS and mortality fMORT changes.
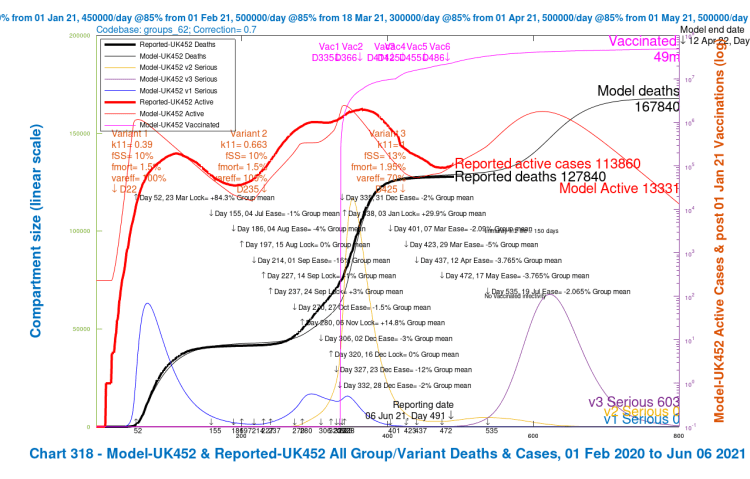
Chart 318 for scenario UK452 with vaccinations and 19th July 2% NPI relaxation. v3 transmission k11 = 1, var_eff = 70%, fss and fmort +30%. Model 800 day outcomes to April 12th 2022 compared with reported active cases and deaths to June 6th. Serious cases for 3 variants 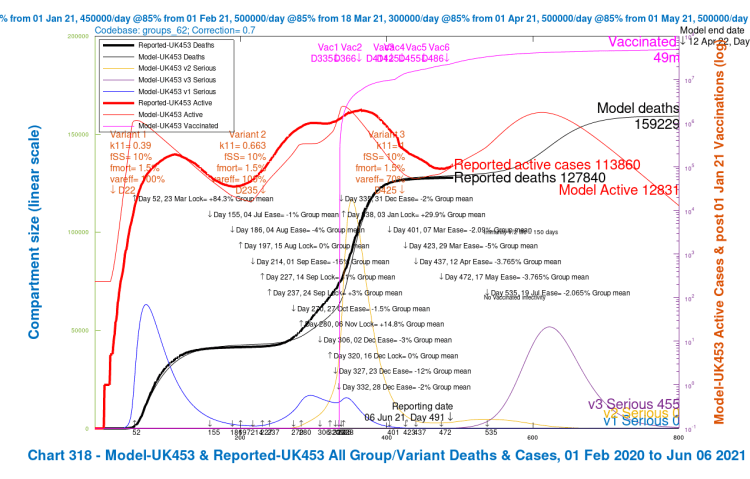
Chart 318 for scenario UK453 with vaccinations and July 19th 2% NPI relaxation. v3 transmission k11 = 1, var_eff = 70%, fss and fmort as v1 and v2. Model 800 day outcomes to April 12th 2022 compared with reported active cases and deaths to June 6th. Serious cases for 3 variants 
Chart 318 for scenario UK454 with vaccinations and July 19th 2% NPI relaxation. v3 transmission k11 = 1, var_eff = 100%, fss and fmort +30%. Model 800 day outcomes to April 12th 2022 compared with reported active cases and deaths to June 6th. Serious cases for 3 variants 
Chart 318 for scenario UK455 with vaccinations and July 19th 2% NPI relaxation. v3 transmission k11 = 1, var_eff = 100%, fss and fmort as fort v1 and v2. Model 800 day outcomes to April 12th 2022 compared with reported active cases and deaths to June 6th. Serious cases for 3 variants
This version of the model (codebase 62) included four age/vulnerability groups, all described in the earlier post, but there is no vaccination hesitation, vaccinated infectivity or multiple inoculations (jabs) per person, all of which I have included in several subsequent iterations of the model, culminating in the current codebase 101.
Model codebase 62 outcomes on August 29th
I have re-run model codebase 62 to see how the results now match the reported data (as at August 29th), for those four earlier scenarios UK452, UK453, UK454 and UK455, with the different combinations of high and low settings for fSS/fMORT and var_eff, again shown in red in the body of the charts in the three Variant parameter lists.
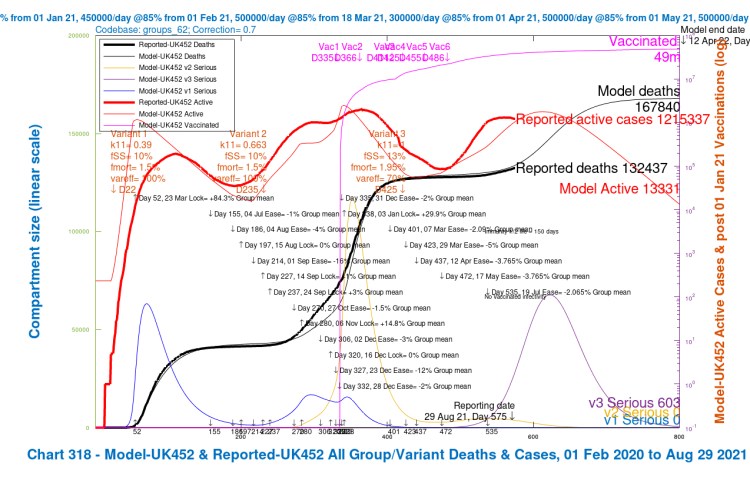
Chart 318 for scenario UK452 with vaccinations and 19th July 2% NPI relaxation. v3 transmission k11 = 1, var_eff = 70%, fss and fmort +30%. Model 800 day outcomes to April 12th 2022 compared with reported active cases and deaths to August 29th. Serious cases for 3 variants 
Chart 318 for scenario UK453 with vaccinations and July 19th 2% NPI relaxation. v3 transmission k11 = 1, var_eff = 70%, fss and fmort as v1 and v2. Model 800 day outcomes to April 12th 2022 compared with reported active cases and deaths to August 29th. Serious cases for 3 variants 
Chart 318 for scenario UK454 with vaccinations and July 19th 2% NPI relaxation. v3 transmission k11 = 1, var_eff = 100%, fss and fmort +30%. Model 800 day outcomes to April 12th 2022 compared with reported active cases and deaths to August 29th. Serious cases for 3 variants 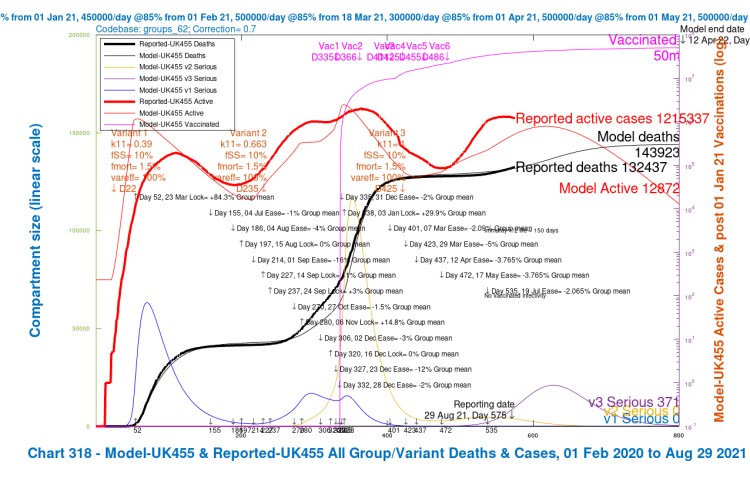
Chart 318 for scenario UK455 with vaccinations and July 19th 2% NPI relaxation. v3 transmission k11 = 1, var_eff = 100%, fss and fmort as fort v1 and v2. Model 800 day outcomes to April 12th 2022 compared with reported active cases and deaths to August 29th. Serious cases for 3 variants
We can see here that the average projection of the model between the four assumptions still fits the reported deaths to date (August 29th), but the modelled active cases, showing a peak in late October, have deviated from the reported active cases, which have already peaked (for the time being).
As we have seen, the counting of cases (and, to a lesser extent, even deaths) in real-life has been somewhat arguable. Testing methodology for cases, and their interpretation, have not been consistent over the life of the pandemic, and it is likely that the proportion of positives in those tested is a better measure of the movement in Covid-19 cases.
The UK Government has also changed the definition of a Covid-19 death over the period of the epidemic; one definition is now limited to a Covid-19 diagnosis within 28 days prior to a death, and the other involves the mention of Covid-19 on the death certificate (a higher number). UK Government published numbers (also quoted by Worldometer for the UK) use the first (lower) definition. The UK ONS (Office for National Statistics) use the latter.
The regular Imperial College REACT studies in the UK have probably been the most reliable indicator of the spread of infection and cases.
In the model outcomes, as noted, there is quite a variation (as might be expected) in the longer term projections depending on the model settings var_eff (the relative vaccine efficacy to v3 compared with v1/v2) and for fSS (the fraction of those infected becoming seriously sick (I call this “virulence” for shorthand) and for fMORT (mortality) rates for variant v3 in the model (corresponding to the Delta variant) compared with earlier variants.
In all scenarios the transmission rate k11 of v3 was set at 50% more than v2 (the Alpha variant), equivalent to 2.56 x that of v1 (the original variant), and this transmissibility has been borne out by observation of v3 over a long period in many countries.
The curious case of infection of and by vaccinated people
I was persuaded and convinced some time ago by research (and other) papers I had read (see reference published in a previous blog post, and also in that April 23rd blog post here), that vaccinated people can infect others.
As I tried to explain then, but not as a virologist or immunologist myself, this has to do with the difference between a) being organically infected (which most vaccinated people are not) and b) carrying viral load in the airways (which vaccinated people can) which can be exhaled and infect others. I therefore built this into the model, as well, of course, as a small percentage of direct infections of vaccinated people for whom vaccination wasn’t effective, which was already in the model codebase 62.
Please take statistical care reading accounts of increasing proportion of vaccinated people going to hospital and Intensive Care Units (ICU), some of who die. At the extreme, if everyone were vaccinated, then, unavoidably, anyone dying (from Covid-19 or anything else) would necessarily have been vaccinated.
As increasingly higher proportions of population groups become vaccinated (especially the older and vulnerable, whose death rate from Covid-19 had been higher) then we are bound to see higher proportions of deaths in hospital being of vaccinated people. It is not an argument against vaccination.
Anyone who says otherwise is ignoring “Simpson’s paradox” in Statistics. See this article from the Medium website, or this tweet from John Burn-Murdoch, a Financial Times data journalist who consistently publishes good analysis of the pandemic, which offer a seat-belt usage analogy for this statistic. If 99% of people use seatbelts in cars, then the vast majority of those in car accidents will be seat-belt users. But their outcomes will be better.
New model codebase 101 structure
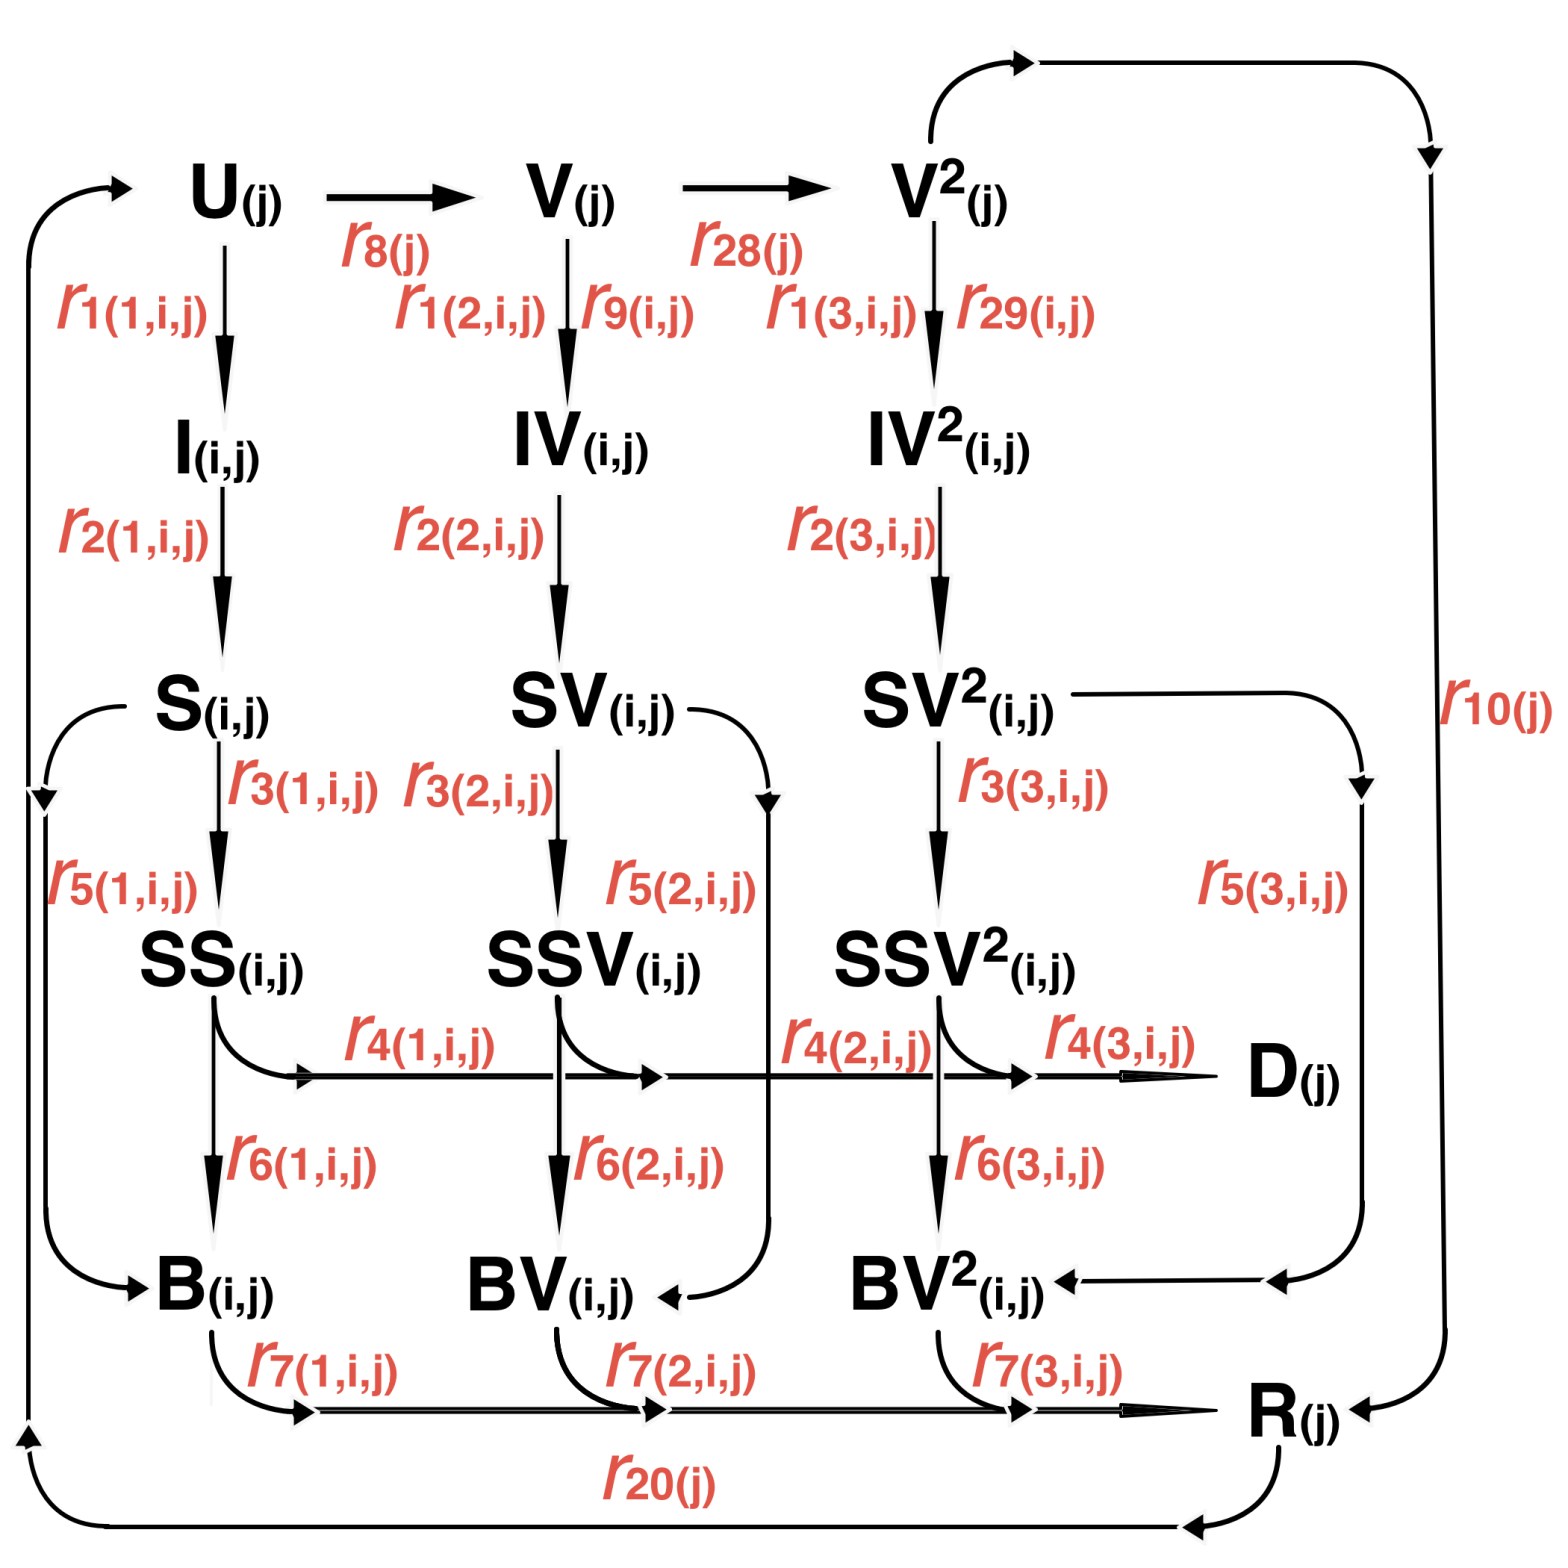
To cope with the infectiousness (and possible infection) of vaccinated people, I therefore expanded the model considerably from 64 compartments (a compartment comprising people in one of a number of possible infection states) to 164 compartments, embracing a much larger number of infection states, including coding for people’s infectivity depending on vaccination status. There are so many compartments because they are all replicated for each age/vulnerability group (4), and most (the infected states) are repeated for each virus variant (3).
As before, there are compartments for each age/vulnerability group for Uninfected (U), Recovered (R), Single Vaccinated (V) and Deceased (D) people, comprising 4×4 = 16 compartments. To these are now added Double Vaccinated compartments V2 in the new model structure, one for each population group (4), making 20 in all so far.
Then there are, as before, Incubation (I), Sick (S), Seriously Sick (SS) and Better (B) compartments for each age/vulnerability group (4) and variant (3) comprising 4x4x3 = 48 compartments.
Finally, for each Vaccination status (one jab or two), I now have equivalent Incubation IV & IV2, Sick SV & SV2, Seriously Sick SSV & SSV2 and Better BV & BV2 compartments for each age/vulnerability group and variant, comprising 2x4x4x3 = 96 compartments.
So in all we have 20 + 48 + 96 = 164 compartments. This does complicate the model considerably (it now takes 20 minutes to run on my MacBook Pro, instead of 5 minutes with 64 compartments for codebase 62 before), but it does allow a more realistic model reflecting the complexities of the way Covid-19 variants work for people in different age/vulnerability groups, and with none, one or two vaccinations. Here is the model compartment structure, with the related transition flows “r”, where “j” labels the four groups and “i” labels the three variants; and (apparently perversely) for the “r” transition rates, r(1,i,j) are the flow rates for no jabs, r(2,i,j) are for 1 jab and r(3,i,j) represent 2 jabs (in Octave, array indices start at 1, not 0).

This can be extended to allow for booster vaccinations when the time comes. If there is waning immunity (as my model allows), then presumably we shall need such boosters, just as the older and more vulnerable in the UK are offered annual vaccines to guard against winter influenza.
If, however, Covid-19 becomes endemic in this way, with regular, seasonal booster vaccines as for influenza, then it would certainly be an over-complication to add further structure to the model for every phase of boosters. On balance, I think I shall seek to avoid this.
Model codebase 101 settings and adjustments
Population groups and susceptibilities
I mentioned earlier that my model is organised into four population groups, differentiated by age/vulnerability, introduced in my earlier posts, most recently in my June 1st post, where I show how the population groups differ in terms of susceptibility to the different variants, particularly variant v3. I use the same population groups for this post. You’ll see that the average virulence fSS and mortality fmort scenarios (the bottom line in the table) are as summarised in the charts, but the model always uses the individual population group settings, even if results are presented UK-wide (as in the Charts 318 above).
| Group | Description | % of UK population | v1 fSS | v1 fmort | v2 fSS | v2 fmort | v3 fSS | v3 fmort |
|---|---|---|---|---|---|---|---|---|
| 1 | Active/younger | 33.5% | 5% | .16% | 5% | .16% | 6.5% | .2% |
| 2 | Caregivers/mid-age | 30% | 12.6% | 1.17% | 12.6% | 1.17% | 16.4% | 1.52% |
| 3 | At risk | 17.5% | 25.2% | 6.26% | 25.2% | 6.26% | 32.8% | 8.14% |
| 4 | School-going | 19% | .63% | .004% | .63% | .004% | .82% | .0051% |
| All | Weighted average by % of population | 100% | 10% | 1.5% | 10% | 1.5% | 13% | 1.95% |
As mentioned, I have reduced some of the settings in the model, for fSS and fMORT, for single and double jabbed vaccine recipients, which codebase 101 can handle. Those changes are implemented through multipliers of fSS, fMORT (which set serious infection and death rates) and settings for vac_inf_prev (which reflects % fractional protection against infection by vaccinated people of others) for the different vaccination states (none, one or two jabs).
All can vary by variant, but for this scenario I keep most the same, with only transmission rate k11 for v3 much higher than for v1 and v2, as described above, and var_eff at 95% for single jabbed people (100% for two jabs) vaccine relative efficacy against v3 compared with v1 and v2.
| Jab multipliers for… | No jabs | 1 jab | 2 jabs |
|---|---|---|---|
| fSS | 1 | .02 | .002 |
| fMORT | 1 | .01 | .001 |
| vac_inf_prev | 1 | .33 | .1 |
| var_eff for v3 | 1 | .95 | 1 |
There is a standard vaccine efficacy vac_eff for vaccines, for all variants, which is set at between 70% and 85% depending on vaccination phase and, and whether first or both jabs, as described in the following vaccination table.
Vaccination schedule
The vaccination schedule differs for the four groups, again the same for this post as for previous ones. Note that children are not vaccinated in the model, as per the regulatory situation so far in the UK, although very soon we expect 12-15 year-olds to be under close scrutiny for vaccination.
From a strictly medical standpoint, the UK’s JCVI (Joint Committee for Vaccination and Immunisation) have just announced that they won’t recommend it for 12-15 year-olds, but the UK Government, who also consider wider perspectives on the societal impact, schooling and mental health of youngsters, might well go ahead with it, as many other countries have. In this case I would either add another phase of vaccination to the model for school-age children (Group 4), at rates that would include the proportional national numbers for 12-15 year-olds in that group, or transfer them from Group 4 into an additional Group 5.
Here is the vaccination table for scenario UK205.
| Model Day | Date from: | Groups included | Vaccinations per day | Efficacy vac_eff 1 jab | Efficacy vac_eff 2 jabs | v1 var_eff 1/2 jabs | v2 var_eff 1/2 jabs | v3 var_eff 1/2 jabs |
|---|---|---|---|---|---|---|---|---|
| 335 | January 1st | Group 3 – At risk only | 300,000 | 70% | 80% | 100%/ 100% | 100/ 100% | 95% / 100% |
| 366 | February 1st | Group 3 – At risk only | 450,000 | 85% | 95% | 100%/ 100% | 100%/ 100% | 95%/ 100% |
| 411 | March 18th | Groups 2 and 3 | 500,000 | 85% | 95% | 100%/ 100% | 100%/ 100% | 95%/ 100% |
| 425 | April 1st | Groups 2 and 3 | 300,000 (first doses) | 85% | 95% | 100%/ 100% | 100%/ 100% | 95%/ 100% |
| 455 | May 1st | Groups 2 and 3 | 500,000 | 85% | 95% | 100%/ 100% | 100%/ 100% | 95%/ 100% |
| 486 | June 1st | Groups 1, 2 and 3 | 500,000 | 85% | 95% | 100%/ 100% | 100%/ 100% | 95%/ 100% |
Scenarios UK202, UK203 and UK204 differ from UK205 only in their base settings of fSS, fMORT and var_eff for v3 as follows, with multipliers modifying the settings for variant v3 as compared to those for variants v1 and v2.
| Variant v3 multipliers | UK204 | UK203 | UK202 | UK205 |
|---|---|---|---|---|
| v3 fSS_mult | 2 | 1 | 2 | 1 |
| v3 fMORT_mult | 1 | 1 | 1 | 1 |
| var_eff (1/2 jabs) | 70/85% | 70/85% | 95/100% | 95/100% |
The importance of the population group view
I will show here Charts 21–24, and the overall Chart 2 in a slideshow to illustrate the different outcomes for the four population groups for one of the scenarios I explore later, UK205.
There are four v3 variant settings available for each scenario, shown in the table above, but here I take UK205 as the exemplar, having the least dangerous of those variant v3 settings; high var_eff percentages (95/100%) and low fSS multiplier (1), to show the variability in outcomes for the four population groups. Similar charts could be shown for any of the scenarios, but the relative characteristics of the charts are common as between population groups.
My main purpose here is to illustrate differences in cases, serious illness and mortality by population group in the model. The slideshow below enables visual comparison of those relative outcomes. Note, for example, how the vaccination schedule (the light blue curve for one jab, and the magenta curve for two jabs in these charts) starts at different times for each group, according to the priorities set by Government for the age/vulnerabilities of the UK population, and is absent for Group 4, school-age children.

Chart 22 Group 1 Young active, for scenario UK205 with vaccinations. 17th May 1.8% and 19th July 1% NPI relaxations. v3 transmission k11 = 1, var_eff = 95/100%. v3 fss and fmort as v1 and v2. Model 800 day outcomes to April 12th 2022 – Healthy, All cases, All infected, Seriously Sick and deaths. Both jabs and 1st jabs only. 
Chart 22 Group 2 Carers and mid-age, for scenario UK205 with vaccinations. 17th May 1.8% and 19th July 1% NPI relaxations. v3 transmission k11 = 1, var_eff = 95/100%. v3 fss and fmort as v1 and v2. Model 800 day outcomes to April 12th 2022 – Healthy, All cases, All infected, Seriously Sick and deaths. Both jabs and 1st jabs only. 
Chart 23 Group 3 Old/vulnerable, for scenario UK205 with vaccinations. 17th May 1.8% and 19th July 1% NPI relaxations. v3 transmission k11 = 1, var_eff = 95/100%. v3 fss and fmort as v1 and v2. Model 800 day outcomes to April 12th 2022. Healthy, All cases, All infected, Seriously Sick and deaths. Both jabs and 1st jabs only. 
Chart 24 Group 4 School-age, for scenario UK205 with vaccinations. 17th May 1.8% and 19th July 1% NPI relaxations. v3 transmission k11 = 1, var_eff = 95/100%. v3 fss and fmort as v1 and v2. Model 800 day outcomes to April 12th 2022 – Healthy, All cases, All infected, Seriously Sick and deaths. Both jabs and 1st jabs only. 
Chart 2 All Groups, for scenario UK205 with vaccinations. 17th May 1.8% and 19th July 1% NPI relaxations. v3 transmission k11 = 1, var_eff = 95/100%. v3 fss and fmort as v1 and v2. Model 800 day outcomes to April 12th 2022 – Healthy, All cases, All infected, Seriously Sick and deaths. Both jabs and 1st jabs only.
We see that the 2021 peak in case numbers for Active/Younger (working and socialising) people and School-age children are very high (~3m), as are infections; they are quite high for mid-age people (~1m), and much lower (~300k) for older people. On the other hand, cumulative deaths are highest for the older / at risk group, and then mid-age, followed by younger people, and tiny for children, as we might expect.
Remember, however, that cumulative deaths include the whole period of the pandemic. After the first quarter of 2021, we see far less growth in deaths in older / at risk people (Group 3), who have been the priority for vaccination, as shown in the vaccination schedule table above, but more discernible 2021 growth in deaths for Groups 1 and 2, Active/Younger and Mid-age. Deaths for children in the UK are minimal, thankfully. At these very low numbers the model overstates that, at even a few hundred by Day 800.
The charts show that in 2021, serious cases (essentially caused by variant v3 as we saw in all the earlier charts 318) peak at ~20-30k for younger and for mid-age people, but a tenth of that for children, and, remarkably, only at double digit figures for at-risk / older people,.
Model settings for variant virulence and mortality for the different groups and vaccination states need to be chosen carefully, but we can already see (and many of my previous blog posts confirm this) that vaccination makes a crucially positive difference for those receiving it. The charts show vaccination starting later for the younger adult groups, and not at all (yet) for children.
Modelling the impact of vaccines on cases, hospitalisation and death rates
As part of the recent public statements by some Government advisers, such as those at Imperial College, the London School of Hygiene & Tropical Medicine and the University of Warwick, estimates have been made of the reduced hospitalisation and death rates as a proportion of case rates in the vaccination environment.
I therefore adjusted fSS (the fraction of those infected becoming seriously sick) and fMORT (mortality) rates in my model accordingly (leaving them as they were originally for unvaccinated people) separately for single and double vaccinated people (see the jab multiplier table above).
I have adjusted the differences in relevant settings in the model for variant v3 (corresponding to the Delta variant) compared with those for the original variant v1, and v2 (the Alpha variant) in the context of the new model multiple vaccination capabilities, ensuring a fit to the 2021 experience to date, i.e. post-vaccination (from the turn of the year), and following the arrival of the (now dominant) Delta variant (from April 1st). (See the v3 settings table above).
It is why, in the model structure above, we need to have so many compartments representing those transition rates and people’s different states of vaccination (or not) and infection. As a result, there are two complete additional columns of infected and/or infectious states for single and double vaccinated people in addition to the original set on the left of the chart.
Model version 101 outcomes on September 3rd
Looking at the eventual outcomes, all of this machinery might not seem at this stage to make a large difference, but it is important when modelling what are to some extent counter-intuitive (and potentially non-linear and/or periodically exponential) outcomes in a pandemic that the transitions between infected states reflect as many of the real world infection relationships as possible, even (and maybe especially) at the start when infection numbers are low.
It has taken me quite a while to incorporate the new interactions, and to balance settings for, and the impact of the multiple vaccination functionality, vaccine hesitancy (different for different groups), immunity waning and the infectivity of vaccinated people (separately for single and double jabs). The current model codebase is at version 101 (as you see in the annotations to the charts below ) whereas my June 6th post presented results from codebase 62. The cumulative 40 versions between them highlight the extent of the changes, and the care I have taken in coding and testing of the changes.

Chart 318 for scenario UK204 with vaccinations. 17th May 1.8% and 19th July 1% NPI relaxations. v3 transmission k11 = 1, var_eff = 70/85%, fss x2 and fmort x1. Model 800 day outcomes to April 12th 2022 compared with reported active cases and deaths to September 2nd. Serious cases for 3 variants 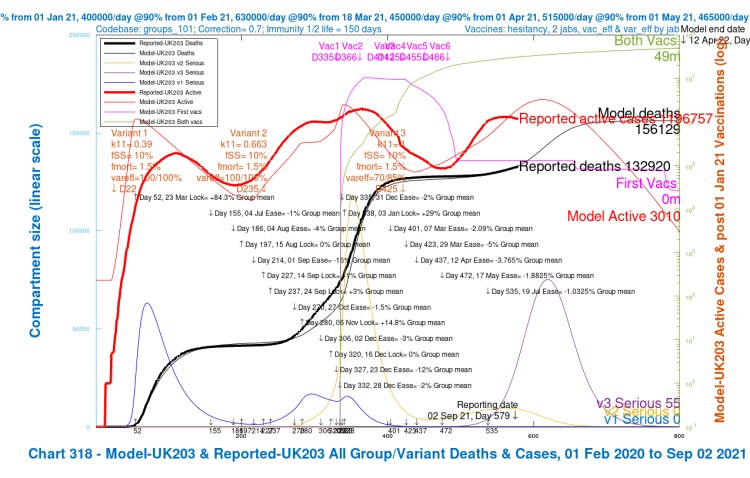
Chart 318 for scenario UK203 with vaccinations. 17th May 1.8% and 19th July 1% NPI relaxations. v3 transmission k11 = 1, var_eff = 70/85%, fss x1 and fmort x1. Model 800 day outcomes to April 12th 2022 compared with reported active cases and deaths to September 2nd. Serious cases for 3 variants 
Chart 318 for scenario UK202 with vaccinations. 17th May 1.8% and 19th July 1% NPI relaxations. v3 transmission k11 = 1, var_eff = 95/100%, fss x2 and fmort x1. Model 800 day outcomes to April 12th 2022 compared with reported active cases and deaths to September 2nd. Serious cases for 3 variants 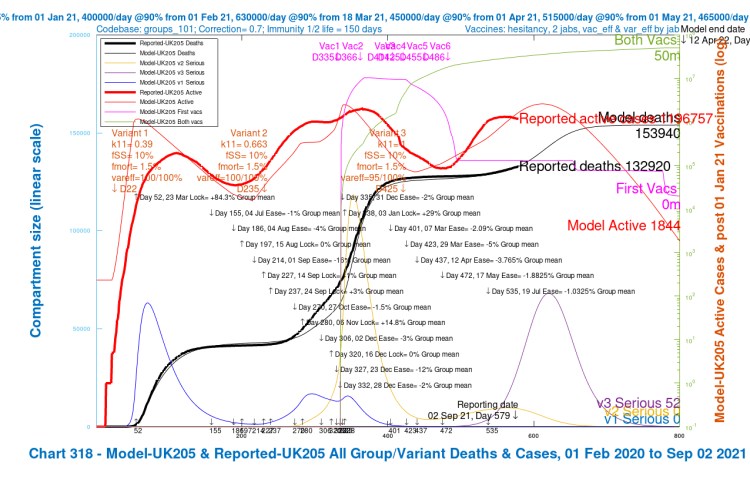
Chart 318 for scenario UK205 with vaccinations. 17th May 1.8% and 19th July 1% NPI relaxations. v3 transmission k11 = 1, var_eff = 95/100%, fss x1 and fmort x1. Model 800 day outcomes to April 12th 2022 compared with reported active cases and deaths to September 2nd. Serious cases for 3 variants
I have presented the slideshow for codebase 101 in an order that reflects the same order of changes to the fSS/fMORT and var_eff (efficacy to variant v3) variables as for the August 29th codebase 62 slideshow above, although the quanta of the changes are different for the new model.
In the new model, we see a smaller range of outcome differences for modelled deaths, for which I have reduced the mortality fMORT considerably for vaccinated people in the new model, to reflect the observed effect in practice. The range of changes in Seriously Sick cases is larger, however, since the relative reduction in fSS (the proportion of sick people becoming seriously sick) for vaccinated people is less than for fMORT, as can be seen in that settings table.
The overall projections for active cases are higher than before before, peaking up to 3m active cases around the end of October. They stood at between 800,000 and 1.2m for codebase 62.
The numbers of Seriously Sick people (a somewhat broader category in the models than real-life hospitalisations) peak at around the same time, but there is also more variation. In the new model, they stand between 70,000 and 150,000, depending on which of the four scenarios we look at. In the older model (codebase 62), the peak, around early November, ranges from about 20,000 to 70,000.
The longer term cumulative deaths projections are similar, averaging somewhat over 150,000 in both models, but with more variation between the four scenarios in the older model.
The variant view
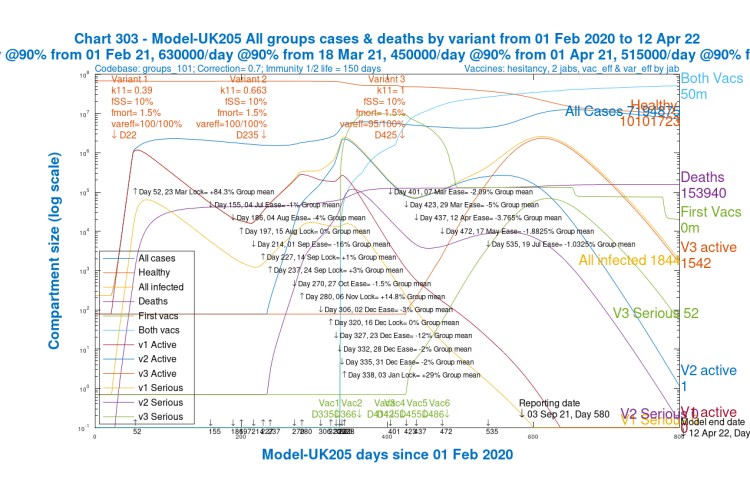
As we can see from the Charts 318 shown earlier, the Delta variant v3 has the dominant influence on active and serious cases in 2021, with v1 having died away in early 2021, and the Alpha variant v2 being quickly overtaken by v3 very soon after its arrival on April 1st 2021.
Chart 303 here, where I use scenario UK205 again as the exemplar, shows the waxing and waning of all three variants. All four scenarios show similar rises and falls.
Discussion
In summary, there are many more active cases than in the previous model, and somewhat more serious cases, but deaths have not increased in the same way in the new model so far. Whether the increased caseload will develop into higher deaths outcomes is yet to be seen. UK Government advisers have, no doubt, been modelling the impact of the return to schools (something I can look at), and the influence of autumn seasonal weather (a somewhat more difficult meteorological task in the UK).
Both models project more deaths between now and the New Year 2022. As before, the absolute figures in the approaches I have modelled are pessimistic, since further actions – other NPIs, surge testing & follow up, and more targeted vaccination for example – would surely be taken if the current daily increases in the reported active cases were to translate into higher rates of hospitalisations, ICU admissions and deaths.
Vaccination is already being considered, as I have said, for 12-15 year-olds, who, apart from those whose immune systems are compromised, are mostly excluded from vaccination at present.
Concluding remarks
There is more work to do, but the outcomes from the newer version of the model are more in line with current observations about the relationship between cases and deaths, with (thankfully) a lower proportion of cases being fatal.
There remains doubt about what the effect of the return to schools for the majority of the UK might be in the near future, combined with the onset of autumn weather. The experience in Scotland (where schools have returned earlier as usual) is that infection rates have increased.
The characteristics of the Delta variant aren’t yet fully understood. Most are agreed on its much higher transmission rate, but because it arrived in the UK (April 1st in my model) well after vaccination was underway in the UK (first vaccination on December 8th, 2020), it is more complicated to assess its effect compared with earlier variants, the vaccination context being very different.
I will explore the settings for the new model further. I suspect that more work is needed to understand the vaccine’s differential effect, as between the recipient (good protection against severe disease and/or death) on the one hand, and contacts of the recipient (less protection from vaccinated people’s infectivity) on the other. See this Lancet article for analysis of the protection offered by double jabs against “long Covid”.
Reference and credits
My model’s origins, beginning over 18 months ago, were based on work by Prof. Alex de Visscher at Concordia University in Montreal. Our January 31st 2021 paper, jointly with Dr Tom Sutton, submitted to the Springer journal Nonlinear Dynamics, is currently available at Research Square, in review. This work explored the group dynamics of the pandemic, also confirming the importance of vaccination in supporting NPI relaxation, based in part on a UK case-study.
In a blog post after that (in my April 23rd post), I was using the new group structure, and postulating a third variant (on January 1st, not April 1st). That post contains much of the UK standing data referenced here, and highlights (as do other posts around that time) the crucial importance of vaccinations in allowing NPI reductions..

2 thoughts on ““Freedom Day”, multiple vaccinations and the Coronavirus Delta variant”