
Summary
In my May 24th post, I discussed the increasing concern about a SARS-Cov-2 variant from India (now denoted Variant of Concern VOC-21APR-02 in the UK Government’s variant database) that as well as having a higher transmission rate (as much as 50% more than that of the Kent variant) might escape vaccines to some extent, and/or be more virulent, causing greater severity of illness with higher mortality.
The UK Government is clearly worried, and some scientific advisers have reportedly suggested more caution about the current and planned NPI (Non-Pharmaceutical Intervention) relaxation regime. As I write this, the BBC has reported such comments from Prof Ravi Gupta. He is Professor of Clinical Microbiology at the University of Cambridge, and also sits on NERVTAG, the UK Government’s New and Emerging Respiratory Virus Threats Advisory Group.
What might pandemic advisers be seeing and highlighting to decision-makers in Government?
I have developed some model scenarios that show examples of what might be behind such expert advice. The scenarios also indicate the importance of the UK vaccine programme, as we face variants with potentially different characteristics of transmission, severity of infection, mortality and responsiveness to vaccines.
Introduction
I have demonstrated before in my blog posts, most recently on May 24th, April 23rd and April 14th, that the UK vaccination programme is fundamental to allowing any lockdown relaxations. Charts for scenarios without vaccination show a runaway situation if lockdown relaxations were to go ahead in the absence of an effective vaccination programme.
In the April 14th post, I was tuning my UK Coronavirus model based on Prof Alex de Visscher‘s original work on a grouped Covid-19 pandemic model. Our work on this model, with a UK case-example, was submitted as a paper with Dr Tom Sutton on January 31st to the Springer journal Nonlinear Dynamics, and is currently available at Research Square, in review. This work also confirmed the importance of vaccination in supporting NPI relaxation.
All my codes are based on an original code from early 2020 developed by Alex at Concordia University in Montreal, with whom Tom and I have been working to develop model extensions for the UK.
This time I am using my UK group model, although focusing more on variants and their vaccine susceptibility than on sub-population groups.
Data on variants
Being sure of the relevant variant data on infectivity, virulence and vaccine efficacy by variant is quite difficult at the moment. There are three India variants on the UK Government list, each with somewhat different characteristics, with VOC-21APR-02 the one of immediate concern, but the others under investigation. Of those recent variants on the list, there is also a March Variant under Investigation (VUI-21MAR-02) from the Philippines, and another in May whose source is yet to be confirmed. A new variant from Vietnam is reported as suspected by the World Health Organisation (WHO) and the Vietnam government, but this hasn’t appeared on the UK Government list yet.

Vaccination schedule
My earlier work with Alex and Tom and our paper confirmed the significant opportunity offered by a vaccination campaign to allow a degree of lockdown easing, through relaxing some NPIs.
Any realistic epidemiological models for the UK must include, therefore, the continuing successful UK vaccination programme, and this is the case in the main charts that follow, although afterwards I also run some sensitivity scenarios to help assess and illustrate the impact of the vaccination programme.
Current vaccination progress in the UK is reported in the following chart from the UK Government Coronavirus website:

The vaccination programme in the model is in 6 phases, starting at 70% vaccine efficacy (vac_eff in the model) during January 2021, with remaining phases at 85% efficacy. The rate of vaccination delivery varies between 300k/day and 500k/day, depending on the phase, matching the UK rollout of vaccination.
For vaccination in the model phase 4 starting on April 2021, for example, I reduce the overall delivery rate to 300k/day to reflect the UK’s reduced vaccine supply situation and the lower first vaccination rate (in favour of second vaccinations).
Vaccination phases are set also to mirror the Government priorities for vaccination to the four sub-population groups I have in the model – Group 1, Active/younger; Group 2, Caregivers/mid-age; Group 3, At risk; and Group 4, School age.
Group 4, school-aged children, are not yet scheduled for vaccination in the model, as there is not yet UK approval for inoculating children with Covid-19 vaccines. The groups, their characteristics and priorities are discussed in more detail in my April 14th blog post.
In the model runs for this post, as I did in my May 24th post, I use a vaccination efficacy multiplier (“coefficient”) var_eff by variant, to allow me to explore the potential for a variant, in these scenarios variant v3, to “escape” the vaccines to some extent.
| Model Day | Date from: | Groups included | Vaccinations per day | Efficacy vac_eff | v1 var_eff | v2 var_eff | v3 var_eff |
|---|---|---|---|---|---|---|---|
| 335 | January 1st | Group 3 – At risk only | 300,000 | 70% | 100% | 100% | 70% or 100% |
| 366 | February 1st | Group 3 – At risk only | 450,000 | 85% | 100% | 100% | 70% or 100% |
| 411 | March 18th | Groups 2 and 3 | 500,000 | 85% | 100% | 100% | 70% or 100% |
| 425 | April 1st | Groups 2 and 3 | 300,000 (first doses) | 85% | 100% | 100% | 70% or 100% |
| 455 | May 1st | Groups 2 and 3 | 500,000 | 85% | 100% | 100% | 70% or 100% |
| 486 | June 1st | Groups 1, 2 and 3 | 500,000 | 85% | 100% | 100% | 70% or 100% |
I will show scenarios with 100% and 70% settings for var_eff for Variant v3, which I introduce to the model on January 1st 2021. For example, if the starting vaccine efficacy vac_eff were 85%, and the variant coefficient var_eff for variant v3 were 70%, then the overall efficacy of vaccines against variant v3 in that model scenario would be (.85×.70)% ≈ 60%.
The impact of vaccine hesitancy
The foregoing exemplar of the effect of vaccine efficay against variant v3 helps highlight the importance of as many people as possible taking the vaccine when offered. If overall vaccine efficacy were even as high at 85%, after assuming zero variant escape from the vaccine (var_eff = 100%), and only – say – 85% of the population take it, we are already as low as (.85×.85)×100% ≈ 72% population protection against variant v3. If variant v3 had 30% vaccine escape (var_eff = 70% for v3) then that 72% would reduce to (.72×.70)×100% ≈ 50%, which is far too low to achieve community immunity for such a transmissive virus.
Even for the original strain of SARS-Cov-2 in the UK, whose reproduction number R0 ≈ 2.5 to 4, 72% is too close to the threshold for community immunity for comfort, let alone for variant v3 with transmission rate (and therefore an R0) of possibly ~2.5 times that of the original variant, even without factoring in any vaccine resistance of variant v3.
I covered the calculations behind this a year ago in my June 28th blog post, following up in my 23rd December post as follows, when talking about the “Kent” variant (which is variant v2 in the present blog post). I insert [comments] for clarity:
“For this new [Kent] strain [v2], whose transmission rate is assumed to be 70% higher than the original [v1], the R0 value will be correspondingly 70% higher (virulence assumed to be the same) and so the range of R0 I have used in previous explanations of community immunity (aka herd immunity), for example in my June 28th blog post, where I discuss it in detail, the R0 of 2.5 to 4 would be increased to an R0 of about 4 to 6.5 for the new variant [v2].
“Thus the range of herd immunity % requirement for the new variant virus [v2], given by H% = (1-1/R0)x100% becomes, instead of a range 60% to 75%, something more like 75% to 85%.“
For variant v3, the subject of this present post, with transmission rate ~2.5 times that of variant v1 and 50% more than variant v2, we might be talking about a reproduction number in the range 6 ≤ R0 ≤ 10, and thus the community immunity requirement H% = (1-1/R0)x100% would become a range of 83% ≤ H ≤ 90% if variant v3 were to become dominant.
Hence I have concerns about “vaccine hesitancy” – a euphemism, in my view, for behaviour (except where medically justified) that threatens public health, not just that of the refuser.
Note: Measles is often quoted as having 12 ≤ R0 ≤ 18. H% could be as high for measles as (1-1/R0)x100% = (1-1/18)x100% = (17/18)x100% ≈ 95%, meaning that almost everyone needs vaccination against measles to achieve community immunity, something many of us are used to from our youth.
MMR (the triple Measles-Mumps-Rubella vaccination) has more recently been the subject of an infamously poor (and that is a euphemism) piece of research by Andrew Wakefield, for which he was struck off the UK’s medical register by the GMC (the UK General Medical Council).
In my view latter-day vaccine hesitancy has been encouraged by such individuals’ actions – Wakefield now plies his trade in the USA as a leading anti-vaxxer – and he and his ilk have much to answer for. It is still happening here in the UK too – a nurse has just been struck off the Nursing and Midwifery Council for spreading related Covid and vaccine misinformation.
Non-Pharmaceutical Interventions (NPIs)
We shall see again the importance of good vaccine efficacy against variant v3. In scenarios where the variant v3 var_eff is 70%, the model shows steeply increasing cases and deaths, starting during the NPI relaxation programme.
My previous work has also indicated how important NPIs have been in helping to control the pandemic, especially before vaccines were approved for use, but also as vaccination has ramped up. Even with the vaccination programme now well developed, NPIs remain an important tool in guarding against a variant that might escape vaccines to some extent.
In previous posts I have shown that if NPIs are not reduced, then the pandemic in the UK is much more controlled, even in the absence of vaccination.
But for economic, social and other health reasons, including mental health, vaccines offer the opportunity to reduce the negative impacts of lockdown that we have seen in these areas.
The current NPI 2021 relaxation schedule in England is as follows (subsequent to the 8th March return to schools), paralleled by similar measures in the other UK home countries. The 2020 history of NPIs, and the 2021 NPI relaxation schedule are reflected in the model settings, much as I used in my April 14th blog post. All current model NPIs (averaged over the four groups) may be seen tabulated in all of the charts, by date and % uplift or reduction accordingly

Model settings summary
In the main model runs for this post, variant v3 (from January 1st 2021) has 50% more transmission (k11 in the model) than (the Kent) variant v2 (as is widely feared about the India variant), and ~2.5 times that of variant v1 (that some call the Wuhan variant).
In the scenarios below, var_eff for variant v3 is 70%, so that the relative vaccine efficacy for variant v3 compared with that for earlier variants is 30% less than for v1 and v2.
Each of the four scenarios, UK723, UK724, UK725 and UK726 has the same variant characteristics for v1, v2 and v3; the differences between these scenarios relate to the presence of a vaccination programme, or not; and of 2021 NPI relaxations, or not, as tabulated below:
| Model scenario | v1 k11 | v2 k11 | v3 k11 | v1/v2 fSS | v1/v2 fmort | v3 fSS | v3 fmort | v1/v2 var_eff | v3 var_eff | Vacs | 2021 NPIs |
|---|---|---|---|---|---|---|---|---|---|---|---|
| UK723 | .39 | .663 | 1.0 | 10% | 1.5% | 13% | 1.95% | 100% | 70% | ALL | ALL |
| UK724 | .39 | .663 | 1.0 | 10% | 1.5% | 13% | 1.95% | 100% | 70% | NONE | ALL |
| UK725 | .39 | .663 | 1.0 | 10% | 1.5% | 13% | 1.95% | 100% | 70% | NONE | NONE |
| UK726 | .39 | .663 | 1.0 | 10% | 1.5% | 13% | 1.95% | 100% | 70% | ALL | NONE |
Group vulnerabilities to variants
All model runs are made using my grouped population UK model code (where the model’s fit to reported data history is reasonably good) which I have continued to extend, to allow more variant parameters to be adjusted.
The variant virulence and mortality settings above summarise the averages of the individual group settings for the four population groups I have used previously in my April 23rd post, reflecting the different vulnerabilities of the groups to the different variants.
| Group | Description | % of UK population | v1 fSS | v1 fmort | v2 fSS | v2 fmort | v3 fSS | v3 fmort |
|---|---|---|---|---|---|---|---|---|
| 1 | Active/younger | 33.5% | 5% | .16% | 5% | .16% | 6.5% | .2% |
| 2 | Caregivers/mid-age | 30% | 12.6% | 1.17% | 12.6% | 1.17% | 16.4% | 1.52% |
| 3 | At risk | 17.5% | 25.2% | 6.26% | 25.2% | 6.26% | 32.8% | 8.14% |
| 4 | School-going | 19% | .63% | .004% | .63% | .004% | .82% | .0051% |
| All | Weighted average by % pop | 100% | 10% | 1.5% | 10% | 1.5% | 13% | 1.95% |
var_eff: variant compliance to vaccines
When the variant v3 vaccine compliance is 70%, the protection of people (who take it!) from this variant is only at (.85×.70)×100% ≈ 60% in most vaccination phases, except in the January phase, when it is (.70×.70)×100% ≈ 50%.
Other parameters, including the propensity of the variant to cause serious sickness (for which I will use the shorthand “virulence”), fss, and its mortality fmort, are as in recent posts; the new var_eff compliance coefficient, set for variant v3 in the next charts at 70%, modifies the vaccine efficacy vac_eff.
Vaccine efficacy vac_eff, as in the Vaccination table above, is set at 70% for Vaccination phase 1 (during January 2021), and at 85% for the later five vaccination phases, from February 1st onwards.
Charts
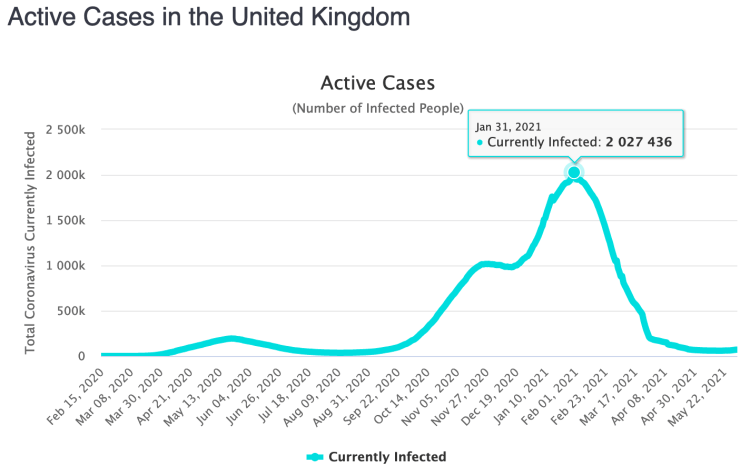
My first chart is Chart 207, showing the the public reported data for total cases, active cases and deaths to May 30th 2021. Data there is sourced originally from the UK gov.uk Coronavirus website, but, more conveniently, I download it from the Worldometer UK site, accessed via a Python code developed by Dr Tom Sutton, and feeding the simulation model to enable comparative charts to be drawn more easily.
Chart 207 – public reported data
Notice on chart 207 how reported active cases have declined from their recent peak in early 2021 (actually on January 31st), but with the rate of decline in the last few weeks having plateaued. Given that UK vaccination numbers are increasing through early 2021, this reduction in the rate of decline is likely to be a result of both the early 2021 relaxations of NPIs, matched by some behavioural relaxation in public compliance with social distancing and other measures.
Some other early public data indicate, however, that variant v3 hospitalisations are not at a greater rate than for previous variants. We also see on the chart the plateau in deaths from Covid-19, which have been running at single digit numbers per day for the UK recently, as confirmed by daily text communications I receive from the WHO (World Health Organisation). As I complete this post, the WHO have reported no Covid related deaths for June 1st, for the first time during the whole UK pandemic.

I will now show just two types of charts (318 and 303) for the model simulations, which between them show the fit to this public reported data for cases and deaths, to date (May 30th 2021) and the way in which the three variants grow (and decline) over the 800 day simulation period.
Chart 318 – overall historic fit and projections
The following charts show how vaccines influence outcomes. Remember that vaccines don’t protect everyone that receives them – vaccine efficacy vac_eff is set at 85% for most vaccination phases in the model. As discussed before, if a variant vaccine compliance coefficient were set at 70%, those that take a vaccine would only be protected to 70% of that starting 85% vaccine efficacy level (≈60%) against that variant, v3 in the case of this post.
In all charts 318, the left hand linear y-axis is for deaths and serious cases, and the right hand log y-axis is for the much larger numbers active cases (the red curve) and vaccinations (the magenta curve, around 50 million successful vaccinations by Day 800 for these scenarios).
UK723 and UK726, with and without NPI relaxations
The first Chart 318 shows the overall deaths and active cases in scenarios UK723 and UK726, in a two-slide slideshow. The only scenario difference is that 2021 NPI relaxations are as announced in the UK723 scenario, whereas there are no 2021 NPI relaxations in scenario UK726, whose last NPI change is the imposition of lockdown on January 3rd 2021. Both scenarios reflect the full UK vaccination programme (plotted in the magenta curve).

Chart 318 for scenario UK723 with vaccinations and 2021 NPI relaxations: v3 transmission k11 = 1, var_eff = 100%. Modelled 800 day outcomes to April 12th 2022 compared with reported active cases and deaths to May 30th. Serious cases from three variants. 2021 NPI relaxations up to June 21st. 
Chart 318 for scenario UK726, with vaccination and NO NPIs: v3 transmission k11 = 1, var_eff = 100%. Modelled 800 day outcomes to April 12th 2022 compared with reported active cases and deaths to May 30th. Serious cases from three variants.
The model’s fit of reported and modelled deaths to May 30th in scenario UK723 is fairly good (the heavier and thin black curves respectively). The reported and modelled active cases (heavier and thin red curves) are quite close to date, especially bearing in mind that reporting of Covid-19 cases has been much less accurate than reporting of deaths over the last year, especially in early 2020.
The notable things to see in scenario UK723 are the plateauing of reported case decline in March (the thicker red curve); the growth in the modelled active cases, the thinner red curve, whose projection starts very close to the plateaued reported curve just after the start of NPI relaxations in March; followed by increases in serious cases (principally caused by the third variant v3 (the purple curve for serious cases); and finally the increased death rate (in black).
As between the two scenarios, we see nearly 62,000 more deaths in scenario UK723 over 800 days, which must arise from the only difference in the two models, the lack of 2021 NPI relaxations in scenario UK726 compared with UK723. The vaccination schedule is the same for both.
These are not forecasts, because I am sure that remedial action would be taken if signs of any such growth (as in UK723) were to be seen in practice. It may be already be under consideration. But as this and my previous posts have shown, it highlights how important it is to act early in managing NPIs to forestall such virus growth, as soon the first signs are seen.
UK726 and UK725, no 2021 NPI relaxation, with and without vaccination
We see very different outcomes for the following scenarios, where neither scenario has 2021 NPI relaxations: UK726 is with vaccination, already shown above, and UK725 is without vaccination, which together indicate the immediate benefits of vaccination, unmodified by the NPI relaxation programme.
The two scenarios UK726 and UK725 are shown below:
Chart 318 for scenario UK726, with vaccination and NO NPIs: v3 transmission k11 = 1, var_eff = 100%. Modelled 800 day outcomes to April 12th 2022 compared with reported active cases and deaths to May 30th. Serious cases from three variants. 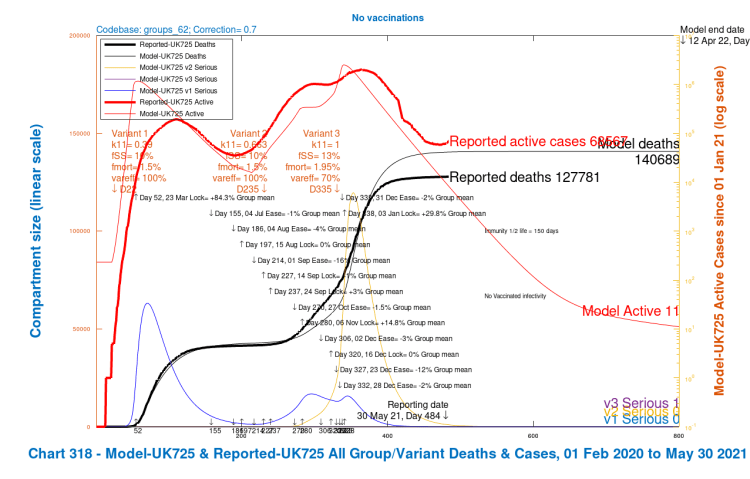
Chart 318 for scenario UK725, with NO vaccinations and NO NPIs: v3 transmission k11 = 1, var_eff = 100%. Modelled 800 day outcomes to April 12th 2022 compared with reported active cases and deaths to May 30th. Serious cases from three variants.
The only difference between the scenarios is the vaccination programme in UK726 compared with none in UK725. Comparison confirms that an effective vaccine, which has vac_eff at 85% for all but the first vaccination phase in January, when it is 70%, even when reduced by 30% in efficacy against a more virulent variant v3 with higher mortality, compared with previous variants, saves around 12,000 lives during 2021-22.
In such scenarios with no NPI relaxation, vaccination controls the model’s otherwise more infective and virulent variant v3, which has 50% higher transmission than variant v2 – the “Kent” variant – and ~2.5 times that of the original variant 1. It also has 30% higher virulence and mortality, and 30% reduction in vaccine efficacy against it. If anything, it is a “pessimistic” version of the India variant, I would say.
But just today, we hear of another Vietnam variant, which might combine some characteristics of both the Kent and India variants.
The rate of decline in reported cases has already flattened out, partly because NPI reductions have, of course, already started, and this, combined with the modelled projections against the background of further relaxations, is causing concern.
The next charts 303, in the two-slide slideshow below, will show in more detail how the different variants contribute to these overall outcomes.
Charts 303 – UK723 and UK726, with and without NPI relaxations, with vaccination: growth and decline by variant, log y-axis
Chart 303 (log y-axis) for model UK723 with NPI relaxation shows variant v3 (the blue and purple curves for active and serious cases respectively) becoming dominant into 2021, variant v2 (the Kent variant, yellow and red curves) having been dominant in late 2020 and early 2021. Variant v1 (the pale blue and orange curves) is in steep decline from the beginning of 2021, when the third UK lockdown started on January 3rd (Day 338 in the model).
The chart for scenario UK726 with no NPI relaxations, as mentioned above, show variants v1 and v2 in steep decline, and variant v3 dying away immediately.

Chart 303 for scenario UK723 with vaccinations and 2021 NPI relaxations: v3 transmission k11 = 1, var_eff = 100%. Modelled 800 day outcomes to April 12th 2022 including active and serious cases from each variant, and all healthy, infected, cases and deaths. 2021 NPI relaxations up to June 21st. 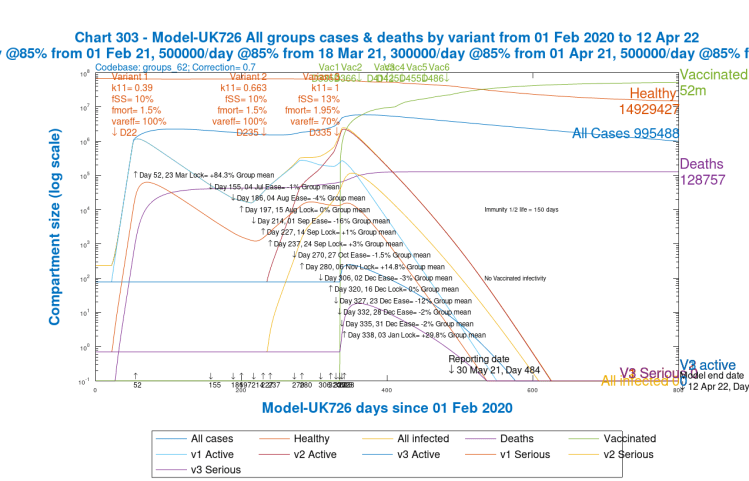
Chart 303 for scenario UK725 with vaccinations and NO 2021 NPI relaxations: v3 transmission k11 = 1, var_eff = 100%. Modelled 800 day outcomes to April 12th 2022 including active and serious cases from each variant, and all healthy, infected, cases and deaths.
Chart 303 – UK726 and UK725, no 2021 NPI relaxations, with and without vaccination: growth and decline by variant, log y-axis
As we saw in the corresponding Charts 318 above for these scenarios, we get a much more controlled picture for both of the scenarios with no NPI relaxations – UK726 and UK725 below:
Chart 303 for scenario UK726 with vaccinations and NO 2021 NPI relaxations: v3 transmission k11 = 1, var_eff = 100%. Modelled 800 day outcomes to April 12th 2022 including active and serious cases from each variant, and all healthy, infected, cases and deaths. 
Chart 303 for scenario UK725 with NO vaccinations and NO 2021 NPI relaxations: v3 transmission k11 = 1, var_eff = 100%. Modelled 800 day outcomes to April 12th 2022 including active and serious cases from each variant, and all healthy, infected, cases and deaths.
In these two scenarios UK726 and UK725, we see again variant v1 causing the 2020 waves of infection, variant v2 peaking in late 2020 to early 2021, and variant v3 not getting started at all, hardly rising above its “seeding” settings in the model.
This is because a) NPIs were already high from January 3rd 2021 when variant v3 it was introduced to the model, with no subsequent NPI relaxations, and b), in the UK726 scenario, the vaccination programme (with the first vaccination on 8th December 2020) was having increasing effect from the beginning of 2021. We saw the resulting 12,000 fewer cumulative deaths in this scenario UK726 earlier in charts 318.
Chart 318 – Scenario sensitivities with different v3 virulence and mortality
Charts 318 for scenario UK723 (previously shown), and for new sensitivity scenarios UK613, UK613 and UK603 show the active cases and deaths compared to reported data, together with the serious cases caused by the three variants plotted separately. As before for chart 318, for each scenario, the left hand linear y-axis is for deaths and serious cases, and the right hand log y-axis is for the much larger numbers active cases (the red curve) and vaccinations (the magenta curve, nearly 50 million successful vaccinations by Day 800 for these scenarios).
The table here shows variant v3 settings for the four scenarios:
| Scenario | v3 Transmission k11 | v3 Virulence fss | v3 Mortality fmort | v3 var_eff |
|---|---|---|---|---|
| UK723 | 1 | 13% | 1.95% | 70% |
| UK623 | 1 | 10% | 1.5% | 70% |
| UK613 | 1 | 13% | 1.95% | 100% |
| UK603 | 1 | 10% | 1.5% | 100% |
Chart 318 for scenario UK723 with vaccinations and 2021 NPI relaxations: v3 transmission k11 = 1, var_eff = 100%. Modelled 800 day outcomes to April 12th 2022 compared with reported active cases and deaths to May 30th. Serious cases from three variants. 2021 NPI relaxations up to June 21st. 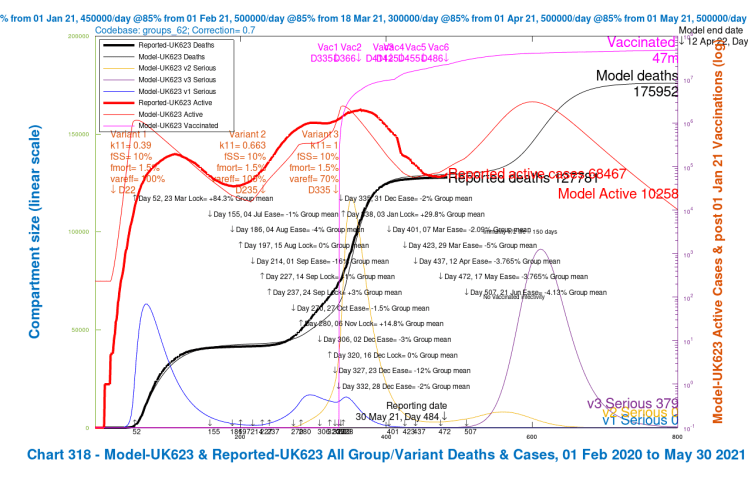
Chart 318 for scenario UK623 with vaccinations and 2021 NPI relaxations: v3 transmission k11 = 1, var_eff = 70%, fss and fmort as for v1 and v2. Modelled 800 day outcomes to April 12th 2022 compared with reported active cases and deaths to May 30th. Serious cases from three variants. 2021 NPI relaxations up to June 21st. 
Chart 318 for scenario UK613 with vaccinations and 2021 NPI relaxations: v3 transmission k11 = 1, var_eff = 100%, fss and fmort 30% higher than v1 and v2. Modelled 800 day outcomes to April 12th 2022 compared with reported active cases and deaths to May 30th. Serious cases from three variants. 2021 NPI relaxations up to June 21st. 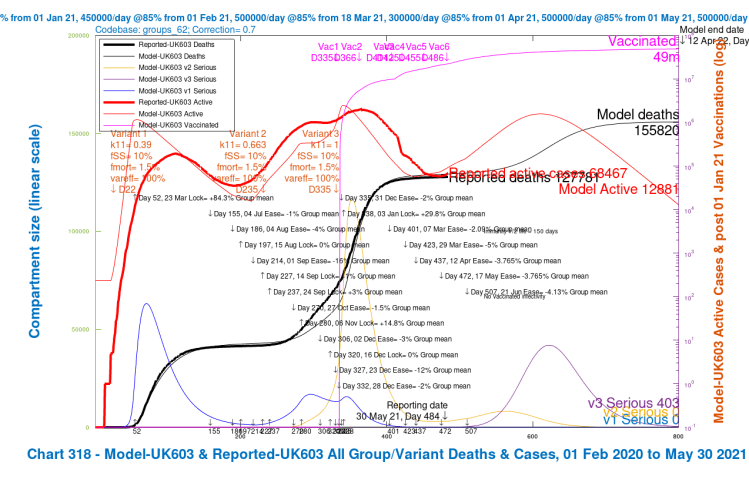
Chart 318 for scenario UK603 with vaccinations and 2021 NPI relaxations: v3 transmission k11 = 1, var_eff = 100%, fss and fmort as for v1 and v2. Modelled 800 day outcomes to April 12th 2022 compared with reported active cases and deaths to May 30th. Serious cases from three variants. 2021 NPI relaxations up to June 21st.
Notice that as the virulence, mortality and the resistance to vaccines is reduced through the four scenarios, the outcomes for deaths are significantly reduced.
The peaks in serious illness (the purple curves for variant v3), which are very relevant to NHS (UK National Health Service) demand are reduced, and also delayed slightly. In all scenarios, however, total modelled active cases peak in mid-September 2021, at between 1 million and 2.5 million, depending on scenario.
By comparison, the peak in reported active cases across the whole pandemic in the UK was 2 million at the end of January 2021, as shown on Chart 207 above, or, equivalently, at Worldometer’s UK page below, driven at that time by variant v2, the “Kent” variant. The Serious cases contributing to that January 31st peak are shown by the variant v2 orange curve in the charts 318 above, for the modelled situation, with the thinner red curve for all active cases matching the heavier red curve for reported active cases quite well.
The four scenarios show the growth in cases by variant, and overall deaths, as for the charts 318 and 303 before. Scenario UK723, the base case previously shown, with 30% higher fSS and fmort and 30% reduction in vaccine effectiveness for variant v3 compared with variants v1 and v2, shows the highest growth in serious cases for variant v3 after the NPI relaxation programme; the other three scenarios show reductions, as mortality (fmort), virulence (fss), and resistance to vaccines are reduced, and (var_eff) is increased to 100%, in different combinations. The effect of the changes is summarised in the table below:
| Scenario | Description of v3 changes | v3 fss & fmort | v3 var_eff | Active cases on Day 800 | Serious Cases on Day 800 | Cumulative Deaths by Day 800 |
|---|---|---|---|---|---|---|
| UK723 | Base case | +30% | 70% | 10,536 | 497 | 189,482 |
| UK623 | fss and fmort as v1 and v2 only | as v1/v2 | 70% | 10,258 | 379 | 175,952 |
| UK613 | var_eff up to 100% only | +30% | 100% | 13,030 | 522 | 163,082 |
| UK603 | Both changes | as v1/v2 | 100% | 12,881 | 403 | 155,820 |
It can be seen that increasing the relative vaccine efficacy against variant v3 to 100% (scenario UK613) has more effect on saving lives (and reducing the peak in v3 serious cases) than reducing the virulence and mortality of variant v3 to those of v1 and v2 (scenario UK623), confirming findings in my May 24th post, using the single population model. Making both changes (scenario UK603) has the most beneficial effect on the death rate, of course, and on the peak in v3 serious cases.
Discussion
I guess that UK government advisers’ modelling might be showing such effects for a highly transmissive, and possibly more virulent and vaccine resistant variant such as variant v3, following the planned NPI relaxation schedule.
The final NPI relaxation is scheduled for June 21st (when Government hope to remove all legal restrictions, apparently somewhat against some scientists’ advice).
Scenario UK723 reported above, and the three related sensitivity scenarios UK613, UK613 and UK603, that all reflect both the vaccination programme and the NPI relaxation programme, with varying overall vaccine efficacy, virulence and mortality for variant v3, all show active and serious cases increasing, albeit at different rates depending on assumptions.
Just a week ago, a study was reported by Public Health Engand (PHE) which indicated (although these are early results) good vaccine efficacy against the India variant (equivalent to my model variant v3). One press report of this work shows the following table:

I expect – and certainly hope – therefore, that outcomes will be much nearer to those in my scenarios UK623, UK613 or UK603, analysed above. The most optimistic scenario, UK603, has v3 with both 100% variant compliance coefficient var_eff, and lower virulence and mortality, as for variants v1 and v2. In all cases the transmission rate of variant v3 remains at 1, ~2.5 times that of variant v1, and 50% more than for variant v2.
The four population groups in the model, differentiated in the model by age and pre-existing vulnerabilities, react differently to the different variants, which I explored with my group model in my April 23rd blog post. I have used this model for this post, and although I haven’t presented results by population group, the model has used those groupings in coming to its conclusions, with results aggregated for the charts presented.
The UK does have the advantage of a strong genomic sequencing capability, and much more is known this year than a year ago about who in the UK is suffering from which Covid-19 variants. But these are early days with the latest variant(s), and data is relatively sparse so far.
Being informed by the science
Reported scientific and Government concerns about new variants in the context of NPI relaxation would be explained by something like the growth effects we see in my model scenarios where effective vaccine efficacy (vac_eff x var_eff) is 30% lower for variant v3.
Even though current India variant infections are quite low in the UK, maybe Government advisers are seeing more growth later on, as shown in my scenarios at some level, in their own modelling?
Second-guessing Government and its advisers is interesting. It’s why I started modelling the pandemic in the first place, in March 2020. Information about data and scientific advice then was hard to source, but there is much more now, including from other commentators, including the Independent Sage group who purport to offer alternative views to the official Government advice group SAGE (The Scientific Advisory Group for Emergencies).
A key aspect is the modelling of the impact and relative effectiveness of the many different NPIs that can be deployed – social distancing, working from home, travel restrictions, school closures, shielding of vulnerable people and many others – and the public’s response to them. Added to this – and to some extent substituting it – is the welcome impact of the vaccination programme in the UK.
The progress of the Covid-19 pandemic doesn’t follow just the classical General Logistics “S-curve” (or even a Gompertz version of it, of which some are so fond), which I had considered in my July 18th 2020 blog post and discarded. I reconfirmed this in my September 5th and October 9th posts.
In the context of a heavily managed NPI environment, and now vaccination, as well as international and domestic cross-infection and super-spreading events, there are far more influences on the pandemic’s progress than can be reflected by just the classical life cycle of a single virus. Over-simplifying this complicated picture has caused some commentators to make highly erroneous forecasts.
In the end, as all advisers emphasise, the decisions are for politicians, not scientists. Weighing up conflicting scientific advice in this novel area of infection is quite a task.
Relevant Government Committees and their roles
Some of the individuals who sit on the UK Government’s advisory Committees sometimes make public pronouncements about SARS-Cov-2 issues facing the UK, usually prefaced with “speaking in a personal capacity”, and I have included some references to these.
I am particularly interested in the modelling work of two subgroups to SAGE. Firstly, the SPi-M (The Scientific Pandemic Influenza Subgroup on Modelling) where I follow the work of Imperial College (for example Neil Ferguson and his team, and Peter Openshaw) and the London School of Hygiene and Tropical Medicine (including Graham Medley, John Edmunds and Adam Kucharski) and others who sit on that Subgroup.
The NPIs I have mentioned above are only as good as the extent to which people will follow them, and to some extent this increases the difficulty that I mentioned of estimating their effect.
The Government gets advice in this important behavioural area from a second SAGE Subgroup, the SPi-B (Scientific Pandemic Insights Group on Behaviours), whose role is to provide behavioural science advice aimed at anticipating and helping people adhere to interventions (both pharmaceutical and non-pharmaceutical) that are recommended by medical or epidemiological experts. It includes Professor Susan Michie and Professor Melissa Parker and many others, and there is quite a degree of cross-membership between these groups.
I mentioned earlier NERVTAG, the UK Government’s New and Emerging Respiratory Virus Threats Advisory Group. It provides scientific risk assessment and mitigation advice on the threat posed by new and emerging respiratory viruses and on options for their management, and advises Government through Chris Whitty (the UK Chief Medical Adviser).
It includes some of those I have mentioned, as there is a degree of cross-membership in these groups; John Edmunds, Ravi Gupta, Peter Openshaw and Neil Ferguson are just some of its members that I have already mentioned.
The JCVI (Joint Committee on Vaccination and Immunisation) advises on vaccination priorities and progress. Their Professor Adam Finn (University of Bristol), along with Professor Susan Michie, have also recently reportedly expressing concerns about the UK’s situation regarding the June 21st lockdown easing step, a report that also includes Prof Ravi Gupta‘s comments already mentioned from another source.
We have all seen on UK television Chris Whitty (UK Chief Medical Adviser) and Sir Patrick Vallance (UK Chief Scientific Adviser) who are leading lights on SAGE, and they provide the public face at Government public and press briefing of much of the medical and scientific advice from these Committees.
Finally, given the importance of vaccines to our future, I mention the MHRA (the Medicines and Healthcare products Regulatory Agency). Their Chief Executive is Dr June Raine CBE, whom we have seen in public briefings, informing the public about vaccination approvals, strategies and priorities, appearing with Prof Lim Wei Shen, JCVI’s Chair of COVID-19 immunisation, based at Nottingham University Hospitals, who also sits on NERVTAG.
Conclusion
For many of the reasons stated, my work, rather than providing definitive forecasts, is more an analysis of the direction of potential changes in the pandemic resulting from putative changes that might be made to many of these different parameters.
It is reassuring that PHE (Public Health England) evidence from emerging studies seems to suggest that the India variant does not escape the vaccines significantly more than previous variants. There are, and will be other random mutations of the SARS-Cov-2 virus, however, and models like this can help look at the potential effects of the postulated or observed characteristics of such new variants.
Once again, my work reported here confirms unequivocally the pivotal role that the vaccine programme plays in controlling pandemic growth while we manage NPIs down to allow the economy, social interactions and travel to return nearer to normal, along with recovery of the pre-pandemic range of wider health services deployment.

2 thoughts on “What are UK Government Coronavirus advisers seeing?”