Introduction
We are aware that the rates of cases and deaths in the USA have increased steeply over recent weeks, and it seems that the natural public relaxation in precautions against Covid-19 for the Thanksgiving holiday period has exacerbated this.
We have only to look at the USA Worldometers page (currently showing 300,000 cumulative Covid-19 deaths in the USA) or, indeed, the Johns Hopkins University website to see this; the USA Worldometers page shows USA daily cases running at 200-250k per day at present, and the death rate at over 3,000 per day, truly alarming figures.

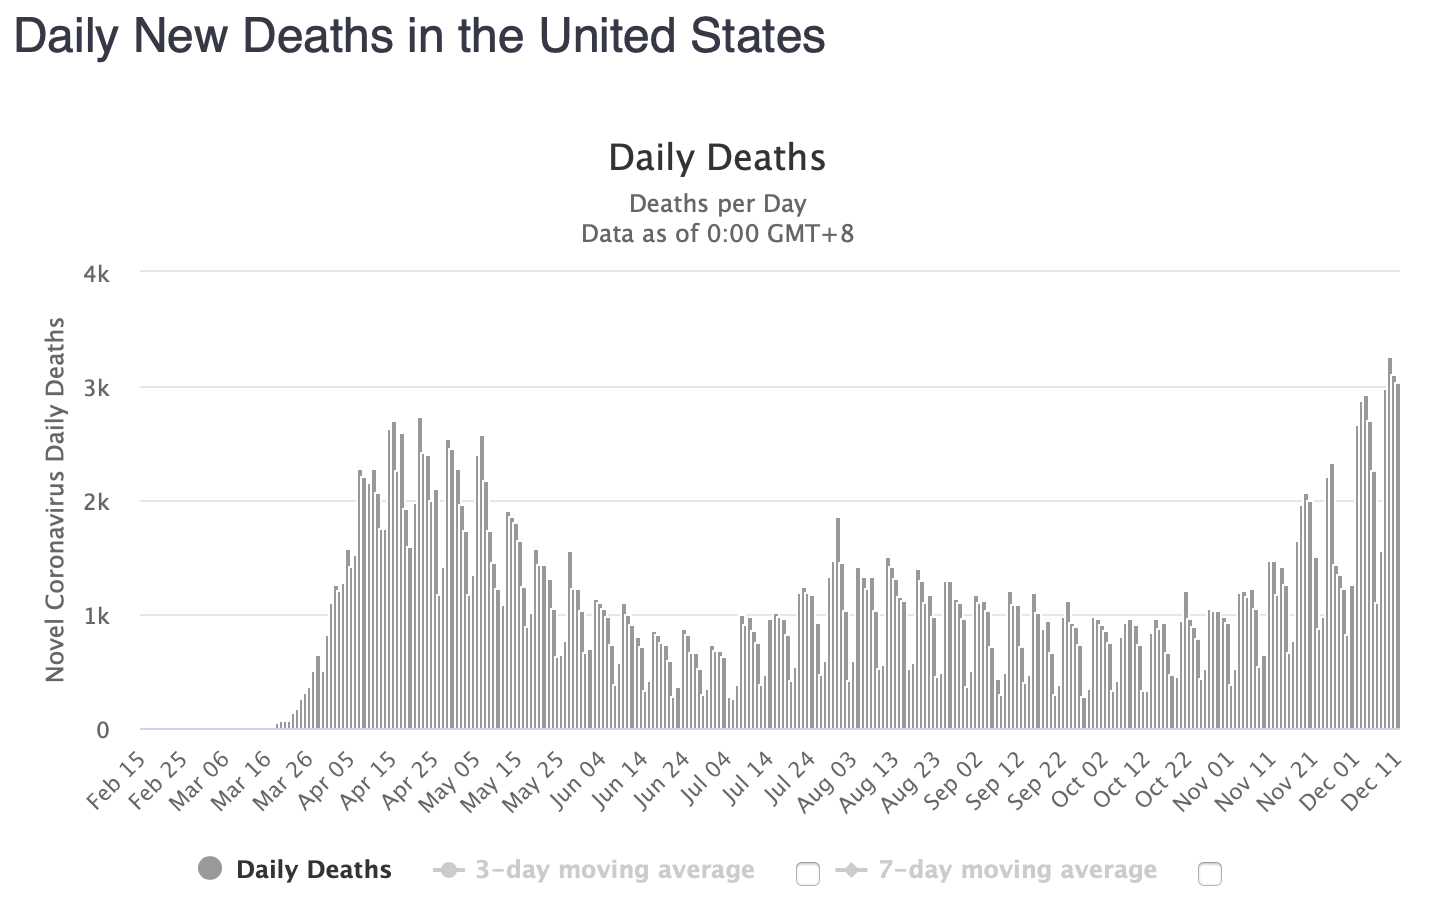
The recent additional peaks in both charts, following late November, are clear. We don’t see these new peaks in the Worldometers page for the UK yet, but will this be the story after Christmas and New Year?


I have run my model with reductions to the USA intervention effectiveness during the Thanksgiving period (reflecting the increase in travel and social interactions in the USA) followed by reintroduction of the intervention effectiveness afterwards, to see the effect on the immediate projections.
I have then applied similar changes to my UK models, to anticipate what the possible effect of such relaxations over the UK festive period might be. This is very much a sensitivity test of some scenarios, not a forecast.
USA comparison with & without Thanksgiving relaxations
I will firstly compare a previous “no-vaccination” scenario in my current USA model (from an original development by Prof Alex de Visscher at Concordia University in Montreal), with no new intervention relaxations, to the new version with Thanksgiving relaxations, to estimate the possible effect.
I trialled several reductions in the Intervention effectiveness % settings and timings in the model, with a reduction on November 21st followed by an increase back to the original setting on December 1st. This is a fairly blunt change, but it does allow the model deaths to be matched with the model deaths up to 8th December.
A 15% reduction and then 15% increase a week or so later seemed to be the lowest change that would represent the pattern of growth in infections and deaths to date. The base cumulative intervention % prior to these changes was sitting at 69%; i.e. the transmission rate of the virus was originally at 31% of its natural starting value at that point, and the ±15% reduction and increase should be seen in that light).
I will compare the 425-day (to April 2nd 2021) no-vaccination chart, with those ±15% changes, with the one used in my recent post, for no vaccinations in the USA, where I had not assumed any Thanksgiving relaxations.
The choice of April 1st 2021 corresponds to the current outlook for USA Worldometers data and the University of Washington forecast, and I will present this afterwards.
Drag the slider in the charts below left and right to see the comparison. The intervention profile is tabulated in the body of each chart. You can see that in the original scenario, the reported deaths were already beginning to diverge noticeably from their previous track, reflected in the model.
Any model does require changes to fit a changed environment (Thanksgiving travel, social and work pattern changes in this case). This is why curve fitting (phenomenological) top-down modelling does a poor job of forecasting (as opposed to interpolation), in my view, whereas a mechanistic bottom-up simulation, with parameters that can reflect the mechanisms of virus and human behaviour, is far better at modelling the future with actual and postulated changes of environment – Government interventions and human behaviour.
In this case, USA human behaviour in this holiday period diverged from the a priori situation (which, admittedly, wasn’t great to start with).

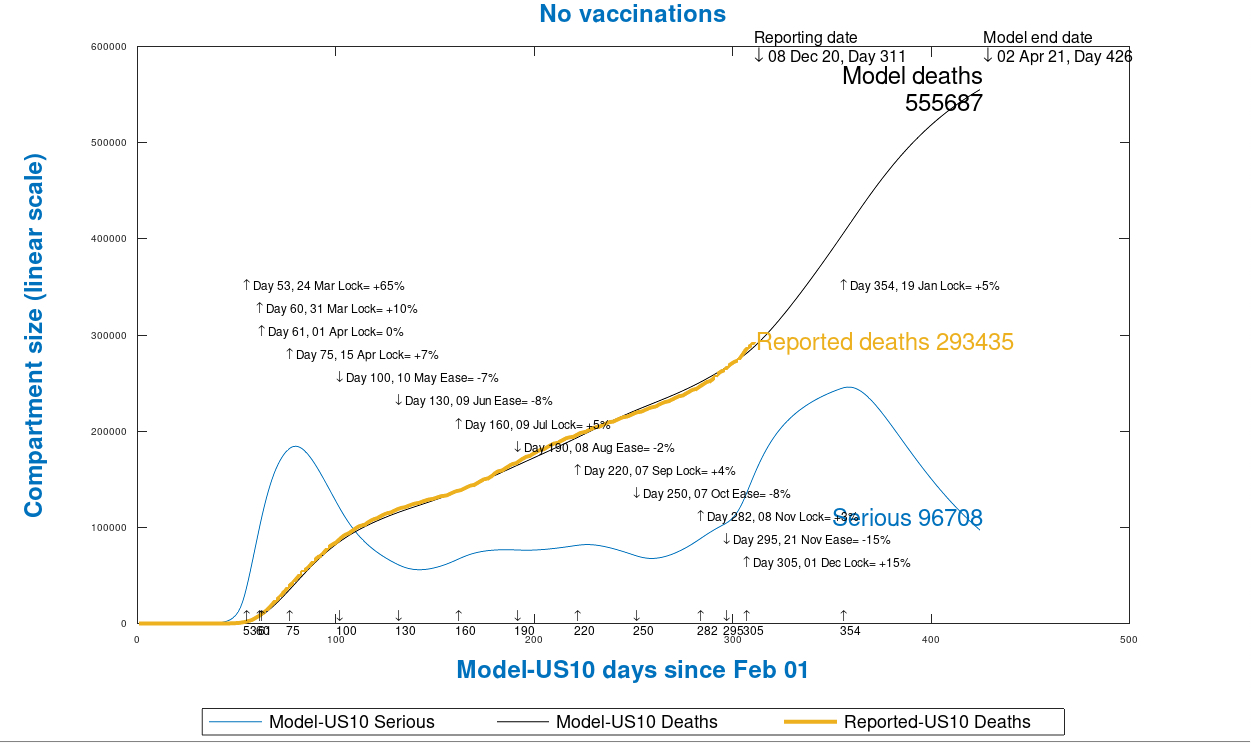
The difference in outcomes of these two model runs is significant, even over the short period of about 120 days of model running from today’s date. In the original case, without my postulated Thanksgiving intervention relaxations, we see 451,398 deaths, and in the “relaxed” case we see 555,687 deaths, over 100,000 more.
This postulated intervention relaxation programme is probably too blunt, and I hope this is very much an unachieved “worst-case” scenario. But looking at the sudden increase in the reported rate of cases, and subsequent death rates after Thanksgiving in the original “no-relaxations” case, some relaxation changes had to be made to align the model output to date with the reported numbers, and this effect continues into the near (120 day) future.
I have not made this comparison for the respective vaccinations cases, as this introduces further uncertainty about assumptions. This is very much a work-in-progress; and these two simpler scenarios already illustrate the sensitivity of the model to such interventions (or the lack of them).
Current USA projections – vaccination vs. no vaccination
Having installed those 15% adjustments for Thanksgiving, I have run two further cases, with vaccination, for each of two projection periods – 425 days (to April 1st 2021) and 800 days (to April 12th 2022), and show these below. April 1st corresponds to the cases above, and 800 days refers back to other model runs I have been making recently.
I have applied a schedule of vaccination from January 1st (a little optimistically) at a rate of 500k/day, followed by 1m/day from February 1st and 1.5m/day from March 17th. These are daily rates that match, as a proportion of population in the US, the vaccination rates I have been using for the UK hitherto, at the same dates.
I have also assumed a 95% vaccination efficacy from the outset, since the Pfizer/BionTech vaccine (already in use in the UK, and approved in Canada so far, and recommended for approval in the USA) and the Moderna vaccine (likely to be approved soon, and also likely to be used in the USA) all exhibit 95% efficacy in trials.
425 days to April 1st, USA, with and without vaccination
First, then, for comparison purposes, a comparison of the “no-vaccination” case, the same as above, for 425 days (to April 1st 2021), with the vaccination case for the same period. Drag the slider from side to side to see the comparison between the two cases. I have assumed the same Non Pharmaceutical Intervention (NPI) programme for each (including the Thanksgiving adjustment), for consistency and comparison with my previous projections.

We see, as before, that the modelled deaths stand at 555,687 for the no-vaccination case, but at 539,255 for the postulated vaccination programme, a modelled reduction of 16,432. This would probably be a best outlook scenario, as I believe my vaccination schedule is optimistic both in timing and rate of inoculation, until I get better evidence of what is achievable in the USA.
800 days to April 27th 2022, USA, with and without vaccination
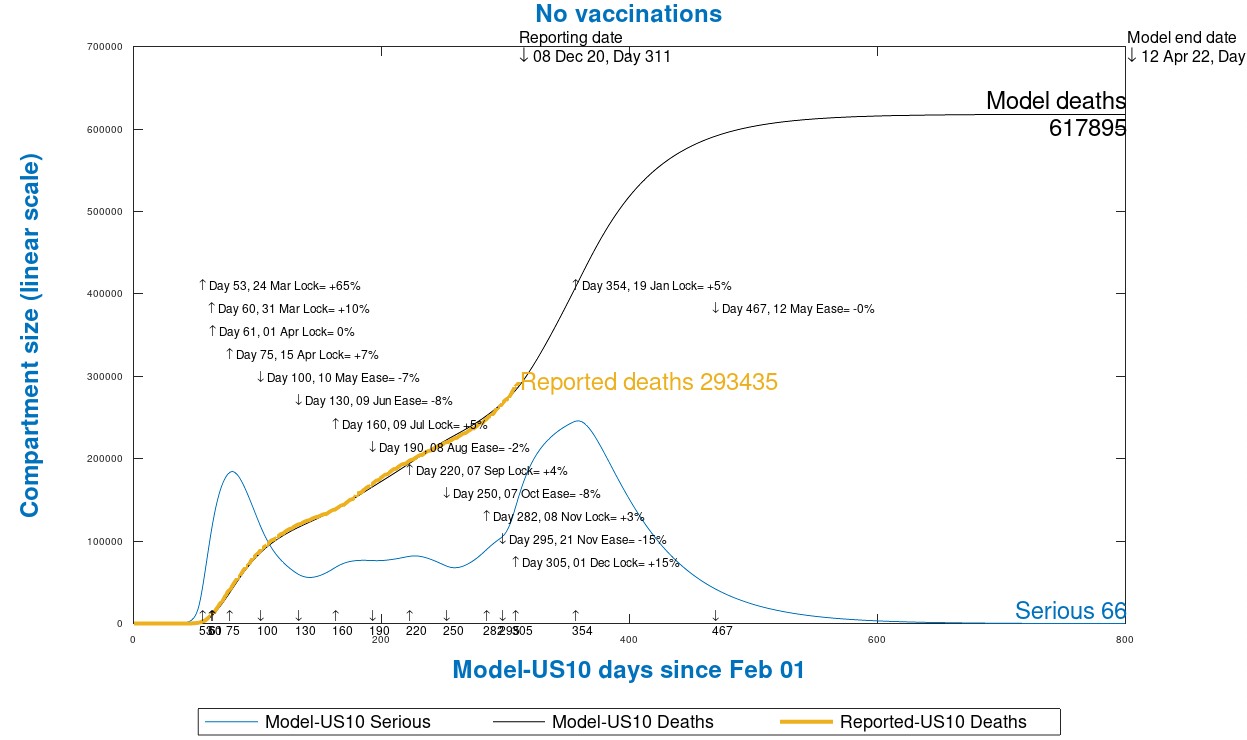

In this case, over the longer term, a year more than the previous scenario, the vaccine programme (as scheduled in the model) saves around 58,000 lives, compared with far fewer (16,000) in the 425 day case above, when the vaccine has less than 3 months to take effect. But this is all very much the subject of change once we know more about the dispensing schedule for the US.
In all of these cases, I have added, as before, an extra 5% intervention effectiveness on USA Presidential Inauguration Day as Joe Biden takes over the Presidency. If, as reported, Biden intends to return to Dr Fauci as a credible adviser (the less than credible Scott Atlas who replaced him in Trump’s favours has already resigned) and is reportedly taking advice from Dr Deborah Birx, I can’t believe a President Biden would allow the current situation to continue unchanged.
USA Worldometers / University of Washington forecast to April 1st 2021
As comparison with my model’s 425 day outlook, the current USA forecast from the University of Washington for April 1st 2021, based on USA Worldometers data (as is my reported data) is as follows.

We see that my model projections, which depending on specific scenarios, are between 539,225 (with vaccination) and 555,687 deaths without vaccination (both with the Thanksgiving adjustment).
My prior model projection, with no Thanksgiving adjustment or vaccinations, was for 451,398 deaths. All of these are well within the error bounds for the various Worldometers forecasts, whose assumptions will be somewhat different from mine, as discussed below.
The briefing notes for the University of Washington projections for the USA make extremely sobering reading, however, and if the numbers in this post are a surprise, that document shows the drivers for the numbers.
In their vaccination model (both for the USA and for the UK), the University of Washington, as described at https://www.healthdata.org/covid/updates/archive, have assumed 50% vaccine efficacy 8 days after the first inoculation, increasing to 95% after the second dose, based on the Pfizer FDA authorization filing.
I have delayed any efficacy until 1st January 2021, albeit at 95% efficacy at that point, for both the USA and the UK.
Given that first inoculations started in the UK on 7th December, and 2nd inoculations would start on 28th December at the earliest, with a further 7 days before immunity in conferred at the “design level” with 95% efficacy, I regard January 1st as a slight stretch, for my vaccination models, even for the UK, and especially for the US where inoculations haven’t yet started.
UK Comparisons
In all of the new scenarios for the UK, I retain the existing intervention schedule up to early December that I have used before, but I have now added a relaxed intervention pattern over Christmas and New Year.
In the case of Christmas, it also reflects some public anticipation of the official relaxations of interventions. The interventions are a little more detailed than for the USA Thanksgiving case, but in principle, although the UK ones are in the future (rather then being matched to reported data) I expect some increase in cases and deaths as a result of less social distancing over the festive period.
I have also added, even though there is no official or formal Government relaxation of interventions over New Year, a degree of informal public relaxation, at that traditional UK holiday and celebration period.
In my model for the UK, therefore, I have set intervention adjustments as follows for the festive period, starting at the a priori December 6th position, which was at a cumulative 71% of intervention effectiveness; in other words, the virus transmission rate in my model had already been reduced to 29% of its natural starting value through prior interventions.
| Date | % adjustment |
|---|---|
| 19th Dec | -5% |
| 23rd Dec | -10% |
| 28th Dec | +5% |
| 31st Dec | -3% |
| 3rd Jan | +13% |
In all vaccination cases for the UK, I have applied a schedule of vaccination from January 1st at a rate of 100k/day, followed by 200k/day from February 1st and 300k/day from March 17th. These are rates that I have used in my previous projections for vaccination forecasts.
UK comparison with & without additional festive period relaxations
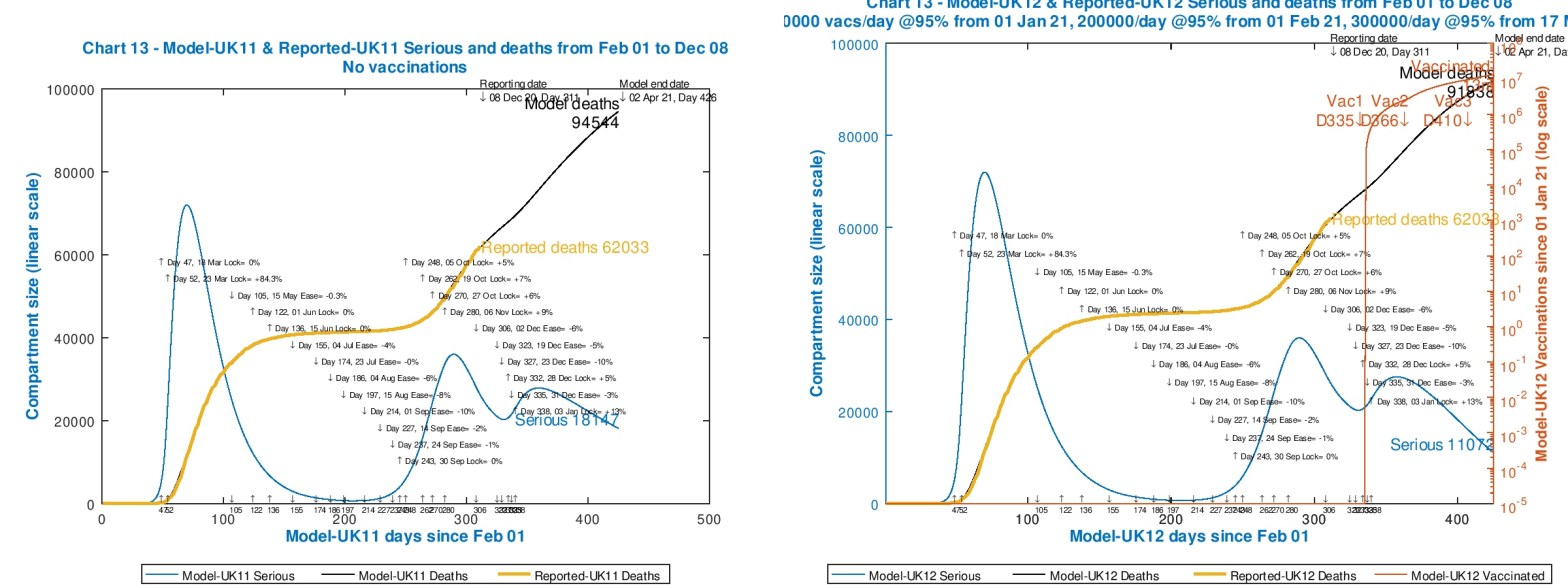
As I did for the USA, I will first briefly compare the previous “no-vaccination” UK scenario used in my most recent post for the UK, without intervention relaxations, to the one with new Christmas and New Year relaxations, as in the table above, to estimate the possible effect.
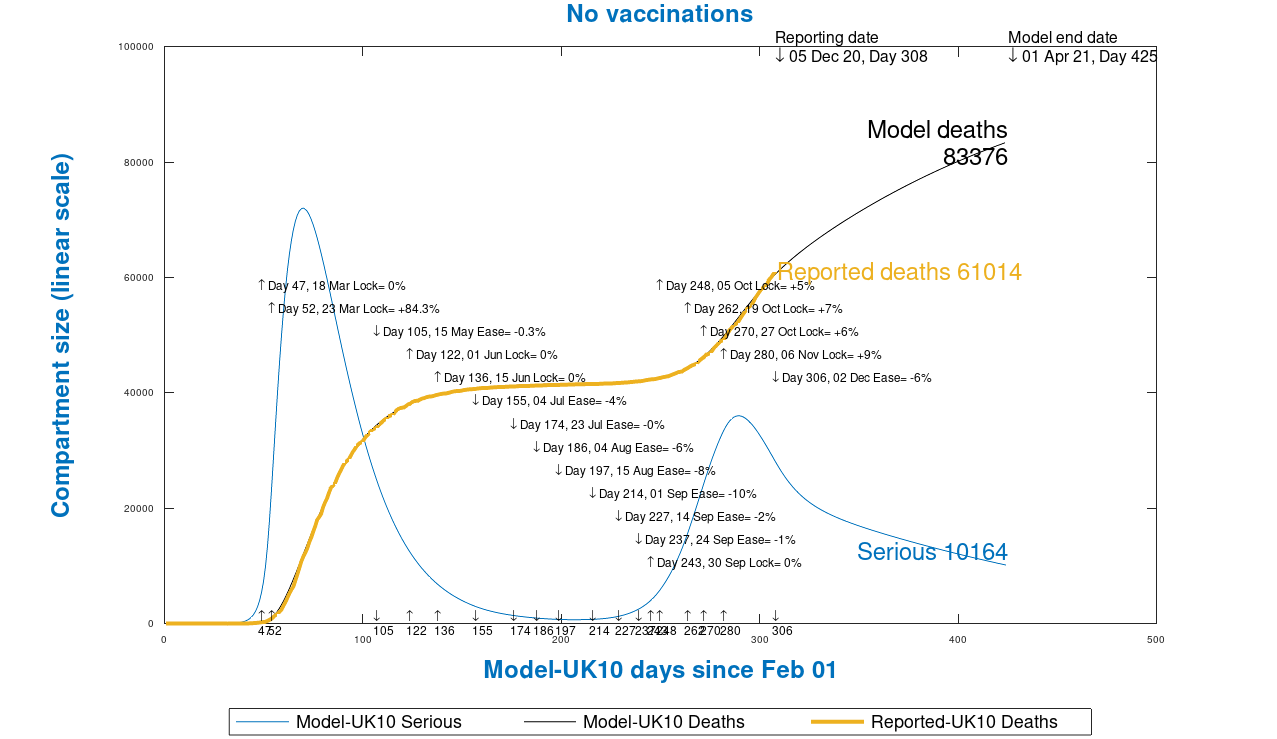

The difference in these two model runs is significant, even over a short period of about 120 days from today’s date. Without my postulated festive intervention relaxations we see 83,376 deaths, and in the “relaxed” case we see 94,544 deaths, over 11,000 more by April 1st 2021.
My postulated intervention relaxation programme is probably too severe, but I hope this is an unachieved “worst-case” scenario.
UK projections – vaccination vs. no vaccination
Having installed these festive period adjustments to the model, I have run two further cases, with vaccination, for each of two projection periods – 425 days (to April 1st 2021) and 800 days (to April 12th 2022), and show these below. April 1st 2021 corresponds to the cases above, and 800 days refers back to longer-term model runs I have been making recently.
As stated, I have applied a schedule of vaccination from January 1st at a rate of 100k/day, followed by 200k/day from February 1st and 300k/day from March 17th. These daily rates match, as a proportion of population in the UK, the postulated vaccination rates I have used for the US above, at the same dates.
I continue to assume a 95% vaccination efficacy from the outset, since the Pfizer/BionTech vaccine (already in use in the UK, approved in Canada, and recommended for approval in the USA) exhibits 95% efficacy in trials.
425 days to April 1st, UK
First, a comparison of the “no-vaccination” case, the same as before, for 425 days (to April 1st 2021), with the vaccination case for the same period. Drag the slider from side to side to see the comparison between the two cases. I have assumed the same Non Pharmaceutical Intervention (NPI) programme for each, as described above, and tabulated in the body of both charts.
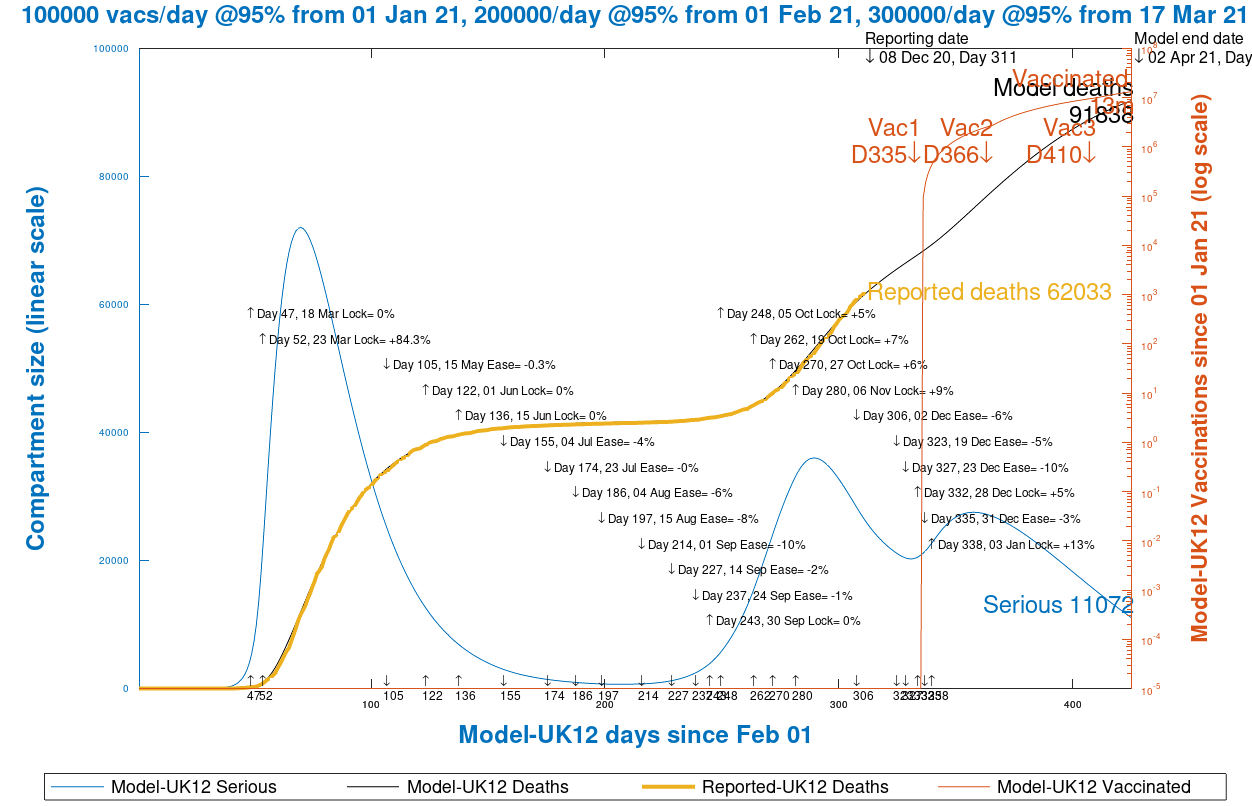
In this short-term 425 day comparison, we save less than 3000 lives through vaccination (the difference between 94,544 and 91838 deaths) since the vaccine has only had 3 months of dispensing at that point.
800 days to April 12th 2022, UK
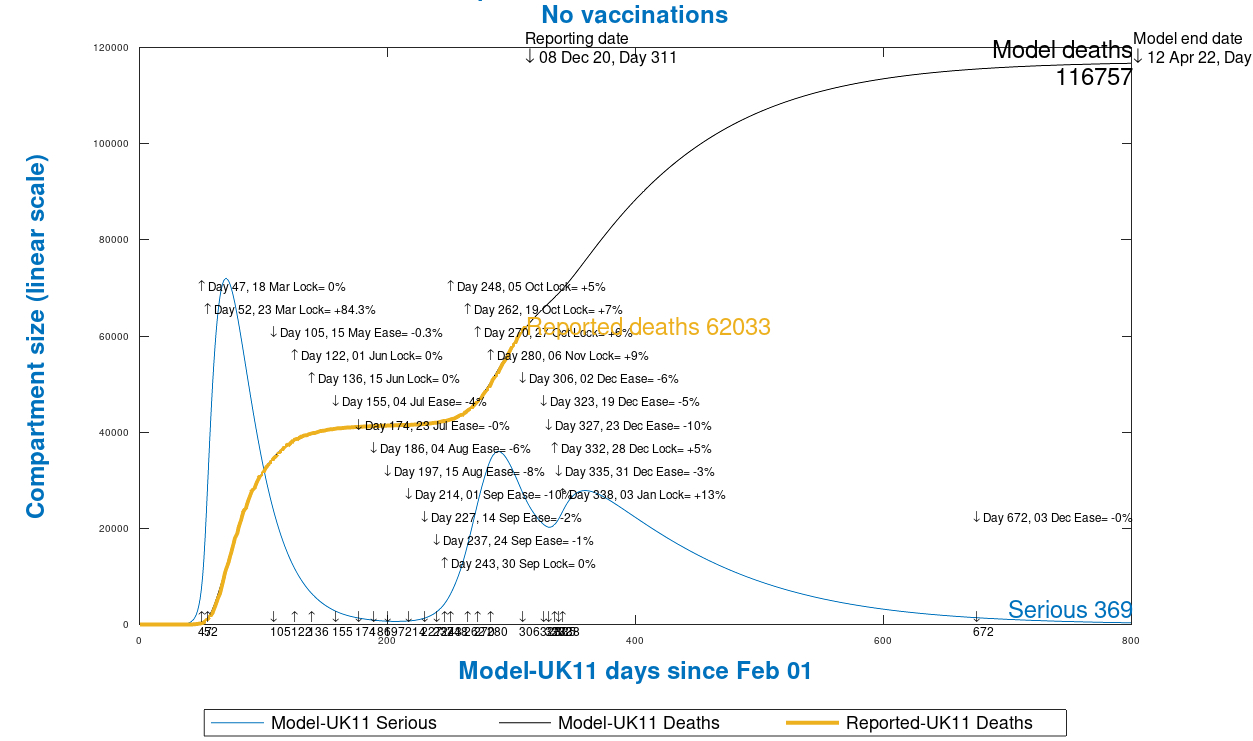

In this case, we see that over 800 days, the vaccine programme might save around 20,000 lives, reducing from 116,757 to 96,169 deaths. But over such long period (a year longer than the previous 425 day scenario) other intervention changes would no doubt take place.
The priority order for vaccine dispensing means that the mortality rate, highest in older people, is likely to fall faster than for random dispensing. But as with the USA scenarios, this is all very much the subject of change once we know more about the dispensing schedule for the vaccine.
From what I have seen during this first week of UK vaccine dispensing since December 7th, I would guess the initial ramp-up in the UK might be somewhat slower than I have modelled. Remember that the vaccine impact on immunity (at 95% efficacy) in the modelling (and in real life) only takes place seven days after an individual’s second inoculation (three weeks after the first), and therefore a 1st January start in the model is somewhat optimistic timing, as is the daily rate of 100,000 per day at that point.
UK Worldometers / University of Washington forecast to April 1st 2021
As a comparison with my model’s 425 day outlook, here is the current UK forecast from the University of Washington, based on Worldometers data for the UK (as is my reported data).

My own model projections, depending on specific scenario, are between 91,838 (with vaccination) and 94,544 deaths without vaccination (both with the festive period intervention adjustment).
The prior model projection for April 1st 2021, with no specific festive period intervention adjustment or vaccinations, was for 83,376 deaths (or, with vaccination, 81940 deaths) as described in my December 2nd post. All of these projections are somewhat below the lower error bounds for the various University of Washington forecasts.
The briefing notes for the University of Washington UK forecasts show the basis for the projections; some assumptions are a little different, for example with vaccination efficacy, as mentioned above, and also with the timing and extent of interventions leading up to and after the Christmas and New Year period.
I hope that the University of Washington projections are very much worst case, and that the UK will be below those numbers.
Discussion
It is clear that the relaxations of interventions over the UK festive period will result in further cases, and likely deaths, unless additional compensating restrictions take place before (unlikely) or very soon afterwards (which is already being discussed).
The ±15% I had set for Thanksgiving in the US over nine days (including the two weekends either side of Thursday, November 26th made a surprisingly large difference to outcomes; I will re-run it when I see a little more of the direction of travel during December.
Associated Press have already reported ‘“It’s a surge above the existing surge,” said Ali Mokdad, a professor of health metrics sciences at the University of Washington in Seattle. “Quite honestly, it’s a warning sign for all of us.”’
The University of Washington is the institution that provides the forecasts based on Worldometers data that I have quoted, and this assessment mirrors my message, that the USA Thanksgiving experience can be a lesson for us in the UK for our own festive period.
The increased rate of reported cases and deaths in the USA around 20th November had been significant, and even a -15% reduction in intervention effectiveness in my model prior to the Thanksgiving period did not fully raise the modelled deaths to that reported level.
I took account, however, of the rate of change (the slope) of the deaths curve too, and the model growth rate parallels the reported rate at that point, although slightly below it, as can be seen from the charts.
But the subsequent increase in intervention effectiveness of +15%, even though only 9 days later, has still allowed the case and death rate to continue to increase for a while, which is expected, as the increase in the death rate always lags the growth in cases a little.
In the UK, my adjustments are a little more graduated (and are for events yet to come, not, as for Thanksgiving, in the past) and embrace the official Government relaxations as well as an estimate of unofficial public relaxation at that time. As I said in the introduction to this post, all of this is very much a work-in-progress, assessing sensitivities by comparing these scenarios.
Concluding thoughts about vaccines
Although the direct reduction in projected deaths in the vaccine model is limited compared with the large numbers of reported deaths in both the USA and the UK (and elsewhere) to date, the vaccine has real value in a) protecting our most vulnerable citizens, where the death rate has been the highest, and b) allowing, eventually (well into 2021, and even 2022, I suggest), a graduated relaxation of interventions, since the vaccine will reduce the size of the target community that the virus can find and infect.
There are two unknowns at the moment: a) how long the protection conferred by the vaccine lasts; and b) whether the vaccine reduces the infectivity of a recipient, as opposed simply to protecting recipients, but not their contacts, from being infected themselves.
All informed commentators (e.g. the UK’s Chief Medical Officer, Prof Chris Whitty, and Chief Scientist, Prof Sir Patrick Vallance) have been very clear that more work is required on those aspects, and so relaxing our guard, once we have been vaccinated, isn’t the right thing to do.
Once again, I refer to the excellent webinar “Ask the Experts”: YouTube video from November 25th about vaccines in the Covid-19 context. It is must-watch video for anyone interested in Covid-19 vaccination (all of us?) with Prof Tim Spector, professor of genetic epidemiology at King’s College London and the Zoe project, and Prof Peter Openshaw of Imperial College, hosted by Christina Hu of the Zoe Covid Symptom Study, and these vaccine differences, and a lot more were covered in that session.

One thought on “USA Thanksgiving Coronavirus lessons for UK Christmas and New Year?”