Executive summary
Since my most recent posts on December 23rd and January 5th I have adjusted my model algorithms to model more than two variants, so that once better data is available on new variant characteristics, I can respond more quickly.
The scenarios I have modelled show that when presented with the threat of new variants, early proactive, preventative and decisive action is necessary as soon as a variant is identified.
If a new variant is allowed to multiply and grow before appropriate Non Pharmaceutical Interventions (NPIs) are introduced, just as with our UK March 23rd response in the first days of the UK pandemic in March 2020, control of the virus is quickly lost.
Introduction
The jury is still out on some important issues:
- do the vaccines reduce transmission to other people as well as protecting the recipient?
- does 12 weeks between first and second doses protect as efficaciously as the tried, tested and approved three weeks for Pfizer and Oxford ZA vaccines?
- do the variants we have seen result in worse outcomes for length and severity of illness, and mortality?
I can’t pretend to provide answers to these virological, immunological and epidemiological questions, which are for the experts in these fields. What I have been doing since my most recent posts on December 23rd and January 5th is to to adjust my model algorithms to model more than two variants, so that once better data is available on new variant characteristics, I can respond more quickly.
I was keen to do this before the South African variant, 501v2 / UK VOC122020/02, lineage B1.351 or 501Y.V2, or another, perhaps a Brazilian one, becomes pervasive too.
As a first step I have modified my model to handle as many variants as required, by indexing the relevant mathematical equations, rather than hard-coding into them just two variants, as I did in my post on January 5th.
This produced some interesting, and somewhat unexpected results, which I have explored by varying the dates in different scenarios when the known second, and then a putative third variant is added to the model (in the context of the two we already have in the UK) the second having become the dominant mode of infection.
Some background on the importance of timing
My initial results reminded me of my post on May 14th 2020, focusing on death rates, and on May 25th 2020 focusing on case numbers, when I investigated with the model the potential outcomes if our UK national lockdown of March 23rd had started two weeks earlier, on March 9th. The model showed an order of magnitude less deaths by May 25th for March 9th lockdown, compared with the actual lockdown date, March 23rd 2020.
The result was consistent in principle with similar work analysing epidemic growth in Scotland by Professor Rowland Kao’s research group at Edinburgh, and Prof Neil Ferguson’s own evidence to the UK Parliamentary Select Committee for Science and Technology, stating that lives could have been saved if lockdown had been a week earlier.
He was quoted here as saying “The epidemic was doubling every three to four days before lockdown interventions were introduced. So had we introduced lockdown measures a week earlier, we would have reduced the final death toll by at least a half. Whilst I think the measures, given what we knew about this virus then, in terms of its transmission and its lethality, were warranted, I’m second guessing at this point, certainly had we introduced them earlier we would have seen many fewer deaths.”
These considerations led me to study the timing of the introduction of further variants to the model for the UK, against the context of the prevailing NPIs (Non Pharmaceutical Interventions). In summary, it turns out (in my model) that if NPIs are too low when the virus variant arrives, then it has the opportunity and time to start to multiply, with a consequent larger effect on outcomes.
If a new variant arrives when NPIs are already high, then it doesn’t have the chance to get going, and dies out.
This might seem self-evident, but the margins for the NPI effectiveness differences are quite small, as between allowing variant growth, or snuffing it out.
Model structure
The original version of my model was written by Prof Alex de Visscher of Concordia University, Montreal, and it is first described in his academic paper (with code) in March 2020.
We independently concluded that an NPI module was needed, and Alex added this in August, detailed in his subsequent publication.
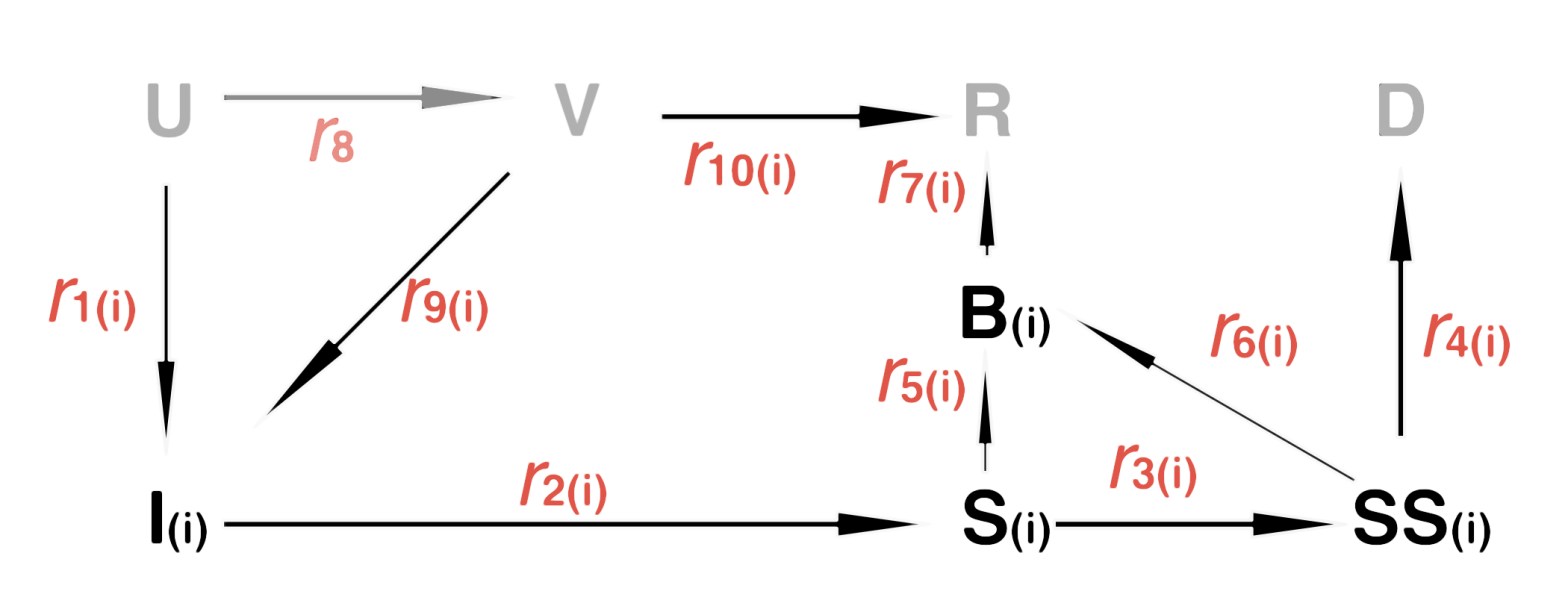
Recall the following diagram from my most recent post, describing the population compartments for two variants v1 & v2:

For the new work, the lower half of this state transitions diagram, with its corresponding transfer rates r1, r2 etc, is essentially repeated for each variant we wish to model (along with their own starting dates and transmission rates).

The repeated elements of the flowchart for variant vi are shown in bold, with the unchanged compartments U (Uninfected susceptible individuals), V (Vaccinated), R (Recovered) and D (Deceased) in grey. All subscripted (i) elements of the chart are repeated for each variant vi in the model. In effect this flowchart replaces the original one when (i) starts at (1) (one).
If any of the answers to the opening three queries I have mentioned were negative, I should have to extend the model – answers which would indeed be somewhat negative for the outlook for 2021.
Vaccine background
I have made no changes yet to my original assumptions for the deployment rate and efficacy of vaccines: dispensing rates of 100,000/day from January 1st 2021, 200,000/day from February 1st 2021 and 300,000/day from April 16th might seem a little low, but recall that the vaccines take some time to have an effect, and these rates would apply following the full effect for the vaccine. But “full effect” is itself a moving target.
The UK Government has, somewhat controversially, decided to delay second doses until 12 weeks after the first, in favour of giving more people their first dose earlier. At leaxt for the Pfizer vaccine, this is contrary to the regulatory approval context, which considered submitted test data with 3 weeks between first and second doses. The interpretation of test data for the Oxford AZ vaccine showed that there can be some odd consequences of varying the inoculation regime.
It is a very unclear picture, with estimates of the efficacy of a single dose being anywhere from 33% (initial data from Israel, who are further along the vaccination track as a proportion of population) to 90%, with other numbers such as 50% and 70% quoted by different agencies and commentators.
I have not changed my assumption yet from 95% for all doses (having assumed the 3 week second dose interval) and this is something, in my view, upon which the Government need to get a grip. It’s a pretty unsatisfactory situation. See https://apple.news/ANm3KItRHRBSU0_dDUC6SPA for more, but there are many other reports of this.
The effect of the vaccine in my model is limited so far, since, although approximately keeping pace with published vaccination rates, the numbers inoculated (at 4-5 million as I write this, of which 10% are second doses) are still a small proportion of the population. The focus at present is on the over 80s and more vulnerable people, with over 70s about to be included.
The model assumes that only uninfected people are vaccinated, although it isn’t clear what pre-inoculation checks might be done, and also whether the vaccine confers any extra immunity (in either reliability or duration) on someone who has, or has recently had the virus.
Comparisons for the timing of introduction of Variant 2
Variant 2 is the virus variant that developed rapidly in Kent, and then in London and the South-east of England, before spreading quite rapidly to other parts of the UK. I won’t enter into tangential discussion about whether its appearance in other countries was independent or transmitted by travellers from the UK.
I presented in my 5th January post a brief history of the UK’s second variant, as follows:

September 22nd second variant introduction
I first reported my modelling for a consecutive second variant in my December 23rd post, exploring a first, simpler method for doing this (variant 2 replacing variant 1).
In my January 5th post, I upgraded my model’s multiple variant methodology and capability, allowing the modelling of concurrent virus variants rather than consecutive ones.
Using an enhanced, indexed version of the model in this post, as I do for all subsequent reporting, my Chart 303 shows the impact of the second variant when introduced into the model on Day 235, (September 22nd 2020) in line when it was first detected (although not announced at the time).

The model outlook here for longer term deaths is worse than when I last reported, as the second variant has spread across the country, despite significant further measures – NPIs – to control it, with the Xmas/New Year period being a time when both Government and the public’s attention was elsewhere. The starting date for the second variant here, September 22nd, is more appropriate to its detection too.
The Government has subsequently instituted, in effect, a third lockdown from January 5th, with more severe measures than expected, with schools announced NOT to be reopening, even though it had been announced (January 3rd for January 4th) that they would open the day before.
My purpose here, however, is to compare and contrast the timing of the second variant introduction, against the background of prevailing NPIs.
Fit of my model to current data: September 22nd second variant
Before looking at the variations to the model outcomes, I present, as a baseline, the current fit and outlook of my model using Chart 17, that I have used before to compare reported and modelled data, for the known case of two variants (the same two-variant scenario as for the Chart 303 above), my current realistic case in the model.
The second variant is introduced on model Day 235, September 22nd, around when it was first detected, according to the timeline shown above.
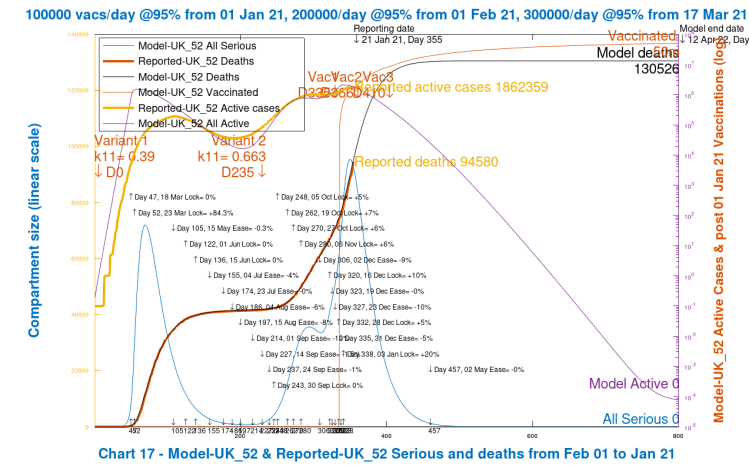
There is very close fit to reported deaths to date (21st January 2021), which I use as the main arbiter of model accuracy, as there is less variability and uncertainty about Government reporting for deaths than there is for cases.
For active cases, the fit is less accurate, but increases and decreases are followed fairly well to date.
Finally, Seriously Sick (SS) numbers show the peaks at around the same time as we have seen in reported hospitalisations and ICU occupancy, but the absolute measure (SS) in the model doesn’t directly correspond to either interpretation. A consistent fraction of the SS measure, however, can be used as an estimator of these reported numbers.
What I am demonstrating here is that the model, for two variants and for NPIs as currently configured, matches reality to date. What follows are parametric versions to investigate the effect of different start dates for the second variant, and for a postulated third virus variant, against this baseline, using the same NPIs.
December 16th 2020 second variant introduction
In my December 23rd analysis for the second UK variant, VOC 202012/01, I introduced the variant on the 16th December (model Day 320), replacing the original variant – a consecutive model. This was about when the second variant began to be discussed in public by the UK Government, who insisted that advisers had only just confirmed its transmissibility, which was stated to be 70% higher than the original SARS-Cov-2 virus.
Running the second variant under that 16th December timing assumption, but with my new concurrent model, the results deviate (downwards) considerably from the baseline September 22nd outcomes above.;

As we see from the green (active cases) and orange (seriously sick cases) curves, the second variant never gets going in this scenario, because the NPIs are already very high at the time it is introduced to the model, 16th December 2020, which snuffs out the new variant (which is seeded with 100 infections, 10 sick individuals and 1 seriously sick individual) at a very low level before it has a chance to multiply and get into its exponential phase; the active case count for the second variant (the green line) hardly exceeds the number of those first seeded cases.
This is just a parametric sensitivity run, since I want to understand the timing issue of variant introduction for further variants. The outlook here is more optimistic than reality as we already see it today, and far more optimistic than projections I made several weeks ago, where I had already introduced the second variant on September 22nd.
The point seems to be that if a new variant is allowed to multiply and grow before appropriate NPIs are introduced (just as in the first days of the UK pandemic in March 2020, with our UK March 23rd response) control of the virus is quickly lost, only regained when NPIs are increased (again).
Such reactive (as opposed to proactive) measures are redolent of my October 29th 2020 cyclical model case, where increasing and decreasing NPIs in response to rising and falling Seriously Sick numbers leads to a cyclical profile for the course of the epidemic. Such outcomes were shown both by Imperial College in their modelling, where NPIs were triggered on and off by ICU bed occupancy thresholds. Harvard University showed a similar outcome.
Third variant comparisons
I am now able to use the new model “indexed” code to add a third variant to the mainstream case for two concurrent variants, shown in the UK_52 case above.
A third variant hasn’t hit the UK in a measurable way yet (according to Sir Patrick Vallance (UK Chief Scientific Adviser) at the January 22nd Downing St presentation’ He said that in the UK, a maximum of 71 people (who have been identified and isolated) are thought to have the SA virus).
The UK Government, learning its lesson from Variant 2, I believe, is considering further border controls to keep the South African and Brazilian variants out of the UK as far as possible. Air corridors, which had been set up some months ago, between the UK and favoured, lower incidence locations abroad, have already been closed for these reasons.
October 22nd third variant introduction
The first 3rd variant v3 case I show, as another parametric study, is for its introduction, for which I arbitrarily set a transmission rate of double that of the original virus (0.78 instead of 0.39), on Day 365, October 22nd, which is a deliberately chosen time of moderate NPIs.
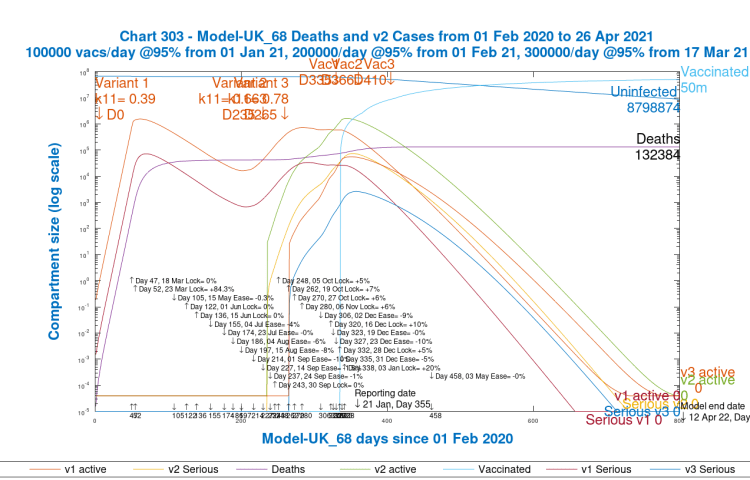
We see that modelled deaths at 800 days, mostly occurring before summer 2021, have increased from 130,526 to 132,384. In the meantime, and preceding the increases in deaths, are Seriously Sick cases from the third virus (the light blue curve) peaking at about 1,200 cases, and v3 active cases of all kinds peaking at about 60,000 cases around the turn of the 2020/21 year.
This v3 start point, Day 265, October 22nd, is when NPIs in the model are at about 74.5% – i.e. the transmission rate of any viruses at that point are at 25.5% of their individual base, nominal values. The NPIs do increase and decrease periodically around that 74.5% value until the end of 2020, reflecting Government measures, but this gives the variant some limited chance to get started.
December 3rd third variant introduction
I now show what happens when we start the third variant at Day 307, 3rd December 2020, when the NPI effectiveness is a little higher at 77.5%, and is about to increase in value by 10% on 16th December, as part of Government revisions to their previous Christmas and New Year relaxation plans, which were mostly abandoned in the light of what turned out to be the effect of the growth of second variant infections.
This time, the higher effectiveness of the NPIs reduces the growth of the third variant significantly:
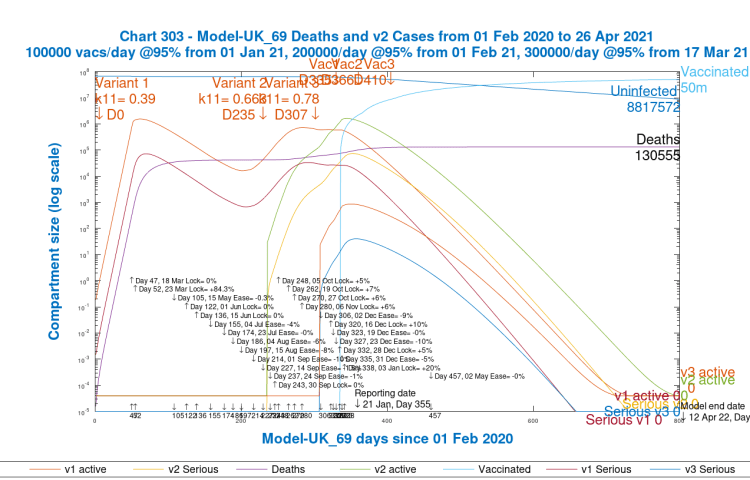
We see very little growth in the third variant (the light blue curve for v3 Seriously Sick and the light red curve for v3 Active Cases), with model deaths after 800 days just 29 more than in the baseline case, well within the error margin for the model equation solver, so not statistically significant.
Even though the third variant is postulated at 0.78 transmission rate (i.e a new infection every 1/0.78 days, or 1.28 days), it is overcome by the prevailing 77.5% NPI effectiveness, rising through 87.5% from time to time, through Christmas and New Year, until a big hit at 97.5% on January 3rd, a much more severe lockdown (in my model) at that point than back in March 23rd 2020 at 84.3% (which was some considerable time after the epidemic had been identified, allowing the original Covid-19 disease time to develop).
Discussion
The lesson seems to be that presented with the threat of new variants, early proactive, preventative and decisive action is necessary, otherwise once the virus variant achieves many infections, it takes a lot more effort to slow it on the faster part of its growth curve.
This message of early and decisive action is a common one, and one that I have recommended (as have most scientists advising Government) from the beginning.
As I write this, we have heard that the UK second variant virus might have a mortality 30% greater for people who have caught it, although this is quite uncertain so far, according to one of the authors, Graham Medley of the London School of Hygiene & Tropical Medicine..
Concluding comments and next steps
In the Government presentation today, as I write this, answers to those three original questions are still needed. If mortality were different for subsequent viruses, some model change is clearly needed (but easy to implement) to the transfer rates between population compartments.
Transmission rates from vaccinated people are still unknown, and the Israel data on the efficacy of one dose of the vaccine (as opposed to two) is also uncertain.
Trial vaccine data for the regulatory approval does look reliable, however, according to Prof Chris Whitty and Sir Patrick Vallance, and immunity duration still looks to be 5 months or so.
The largest assessed number of people in UK with the SA variant is 71. NPIs, as we have seen above, are vital to controlling new variants, especially before vaccines have been fully deployed and taken effect.
Although the SA and Brazilian variants are not thought by Prof Chris Whitty and Sir Patrick Vallance to have higher transmission rates (although there are mixed signals on this, Matt Hancock, UK Minister for Health, seemed to indicate today that he thought the Brazilian variant was more transmissible.
The evidence from my model is that timing and effectiveness of NPIs in this situation is crucial to controlling the impact of any new variant, whatever its transmission rate.

3 thoughts on “The timing of multiple Coronavirus variants”