
In my most recent post on February 12th, I described modelling work I had done in support of Prof. Alex de Visscher’s paper, in conjunction with Dr. Tom Sutton, on “Second-wave Dynamics of COVID-19: Impact of Behavioral Changes, Immunity Loss, New Strains, and Vaccination” which has now been published for peer review as a pre-print on Springer’s site at https://www.researchsquare.com/article/rs-195879/v1. I have now added vaccination and multiple variants I had already added to our previous model into the new grouped population model, and this blog post reports on progress with that new model.
Tag Archives: Coronavirus
Concurrent Coronavirus two variant modelling

I present an analysis of the pandemic situation in the UK, with two Coronavirus variants present since December 16th, and sensitivities to different New Year 2021 Non Pharmaceutical Interventions (NPIs), but always with the background of vaccine dispensing, which started in the UK on December 8th.
Exploring the possible impact of the new variant Coronavirus
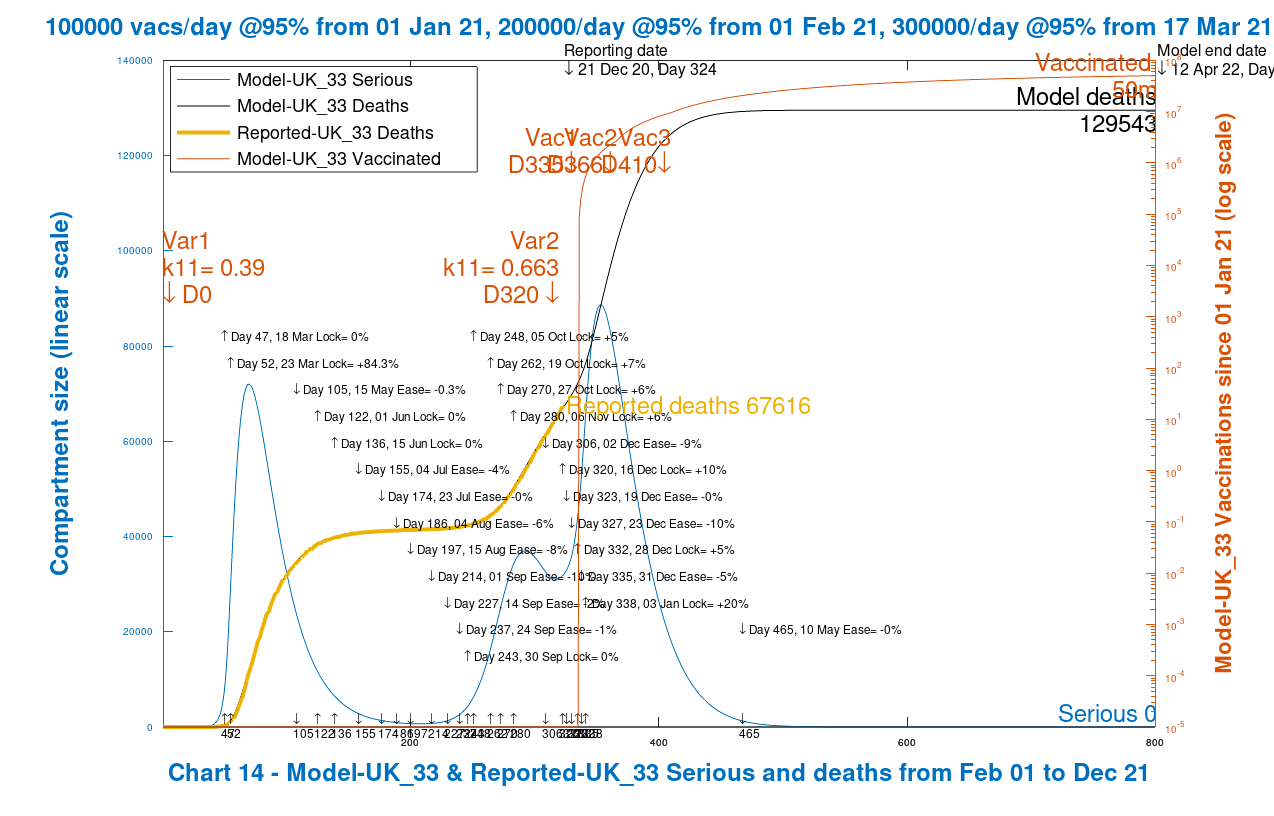
I cautiously welcomed “the end of the beginning”, and events since then have borne out the need for caution, with the discovery of a mutant variant of the SARS-Cov-2 virus (denoted VUI-202012/01) which seems to have a much greater transmission rate, as much as 70% more than the strain of SARS-Cov-2 we have seen previously in the UK. I have developed a further version of my Coronavirus model which now includes not only intervention capability but also a vaccination module, as reported before, and now the ability to add further virus strains with different transmission characteristics.
Vaccine, vaccine, vaccine, vaciiiine,…(don’t refuse it, just because you can) Coronavirus

In the news today, I read that Dolly Parton had given $1,000,000, through her Covid-19 Research Fund, to help fund the Moderna vaccine development. As The Times newspaper reported, this – erm – somewhat trumps the White House contribution to public safety. In her honour, Ryan Cordell composed and performed this ditty. The timing neatly coincides with the work I have been doing to incorporate vaccination into my Coronavirus model, and to that end I have been researching ways of modelling vaccination. I have made some appropriate changes, and run some model options for different vaccine efficacy; vaccinations per day; and date of starting the vaccination programme.
Make America well again – Coronavirus

I look at the impact of a postulated change in the timing of further measures to control the Covid-19 epidemic in the USA, against a current background of rapidly increasing daily case numbers and deaths. I also show an updated projection for the UK, both compared with Worldometers forecasts
Adaptive triggering and the Coronavirus epidemic life-cycle

Introduction In my last post on October 21st, looking at the potential for an exit from the epidemic, I described a cyclical version of the modelling of the epidemic in the UK, reflecting outputs from Imperial College and Harvard earlier this year, which postulated a continuing cycle of partial lockdowns, easing of restrictions and upsurgesContinue reading “Adaptive triggering and the Coronavirus epidemic life-cycle”
Recent events and Coronavirus model update

Many countries, including the UK, are experiencing a resurgence of Covid-19 cases recently, although, thankfully, with a much lower death rate. I have run several iterations of my model in the meantime, introducing several lockdown adjustment points, since my last blog post, as the situation has developed. The key feature is the sharp rise cases, and to a lesser extent, deaths, around the time of the lockdown easing in the summer. I have applied a 10% increase in current intervention effectiveness on October 19th (although there are some differences in the half-term dates across the UK), followed by a partial relaxation after 2 weeks, -5%, reducing the circuit-breaker measure by half – so not back to the level we are at currently. The effect of that change is shown in the final chart in the blog post.
Coronavirus model updates for UK lockdown easing points
As I reported in my previous post on 31st July, the model I use, originally authored by Prof. Alex de Visscher at Concordia University on Montreal, and described here, was to be updated to handle several phases of lockdown easing, and I’m glad to say that is now done. Alex has been kind enough already to adopt a method I had been considering, of introducing an array of dates and intervention effectiveness parameters, and I have been able to add the recent UK Government relaxation dates, and the estimated effectiveness of each into a new model code. I have run two sets of easing parameters as a sensitivity test.
The effect of lockdown easing in the UK – Coronavirus
As reported in my previous post, there has been a gradual reduction in the rate of decline of cases and deaths in the UK relative to my model forecasts. This decline had already been noted, as I reported before, by The Office for National Statistics and their research partners, the University of Oxford, and reported on the ONS website.
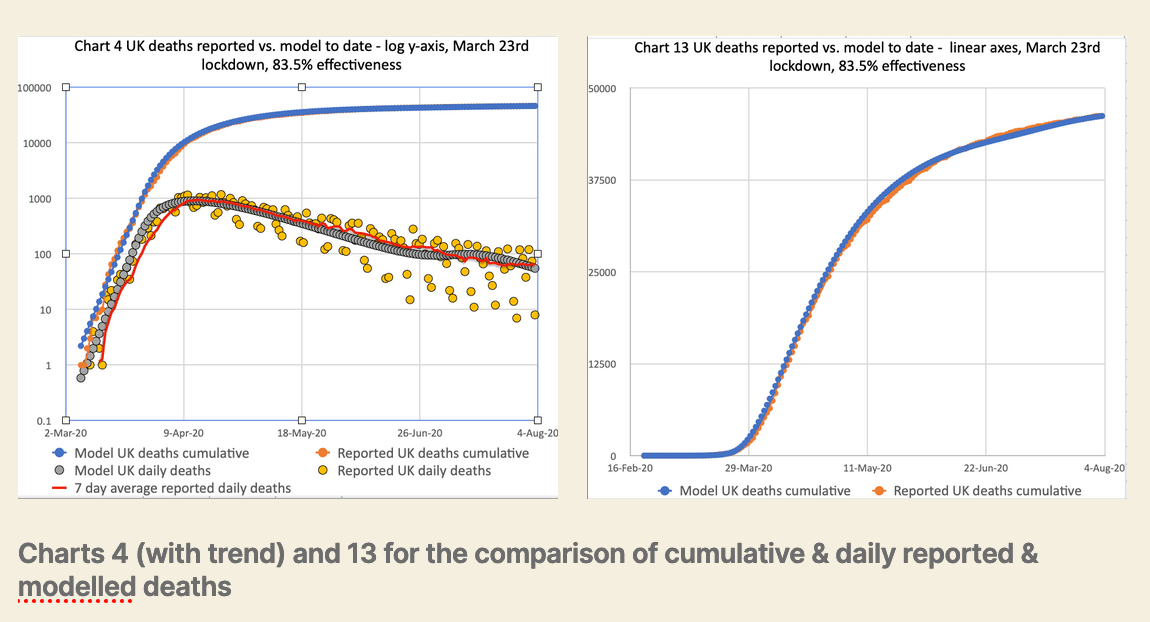
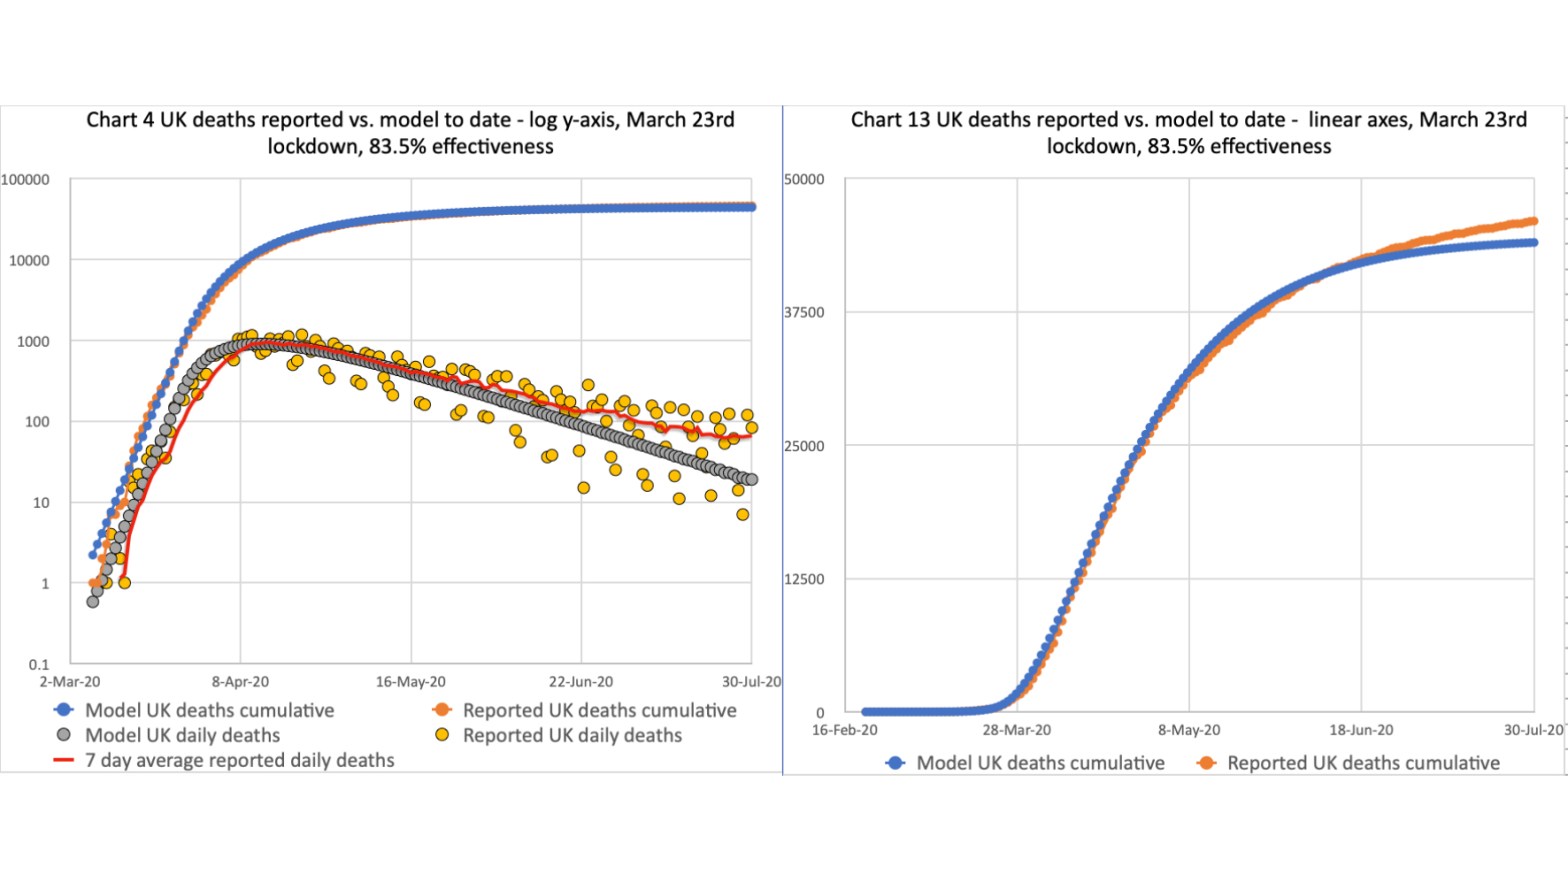
I had adjusted the original lockdown effectiveness in my model (from 23rd March) to reflect this emerging change, but as the model had been predicting correct behaviour up until mid to late May, I will present here the original model forecasts compared to the current reported deaths trend.
Mechanistic and curve-fitting UK modelling comparison – Coronavirus

I thought it would be useful, at least for my understanding, to apply a curve-fitting approach to some of the UK reported data, and also to my model forecast based on that data.
