
This article presents two case number comparison charts for the 9th March and 23rd March 2020 UK Coronavirus lockdown dates. I had covered the deaths data in more detail in my previous post on this topic, and add that here too.
Category Archives: Tim Spector
Declining Omicron cases but increasing deaths – Coronavirus

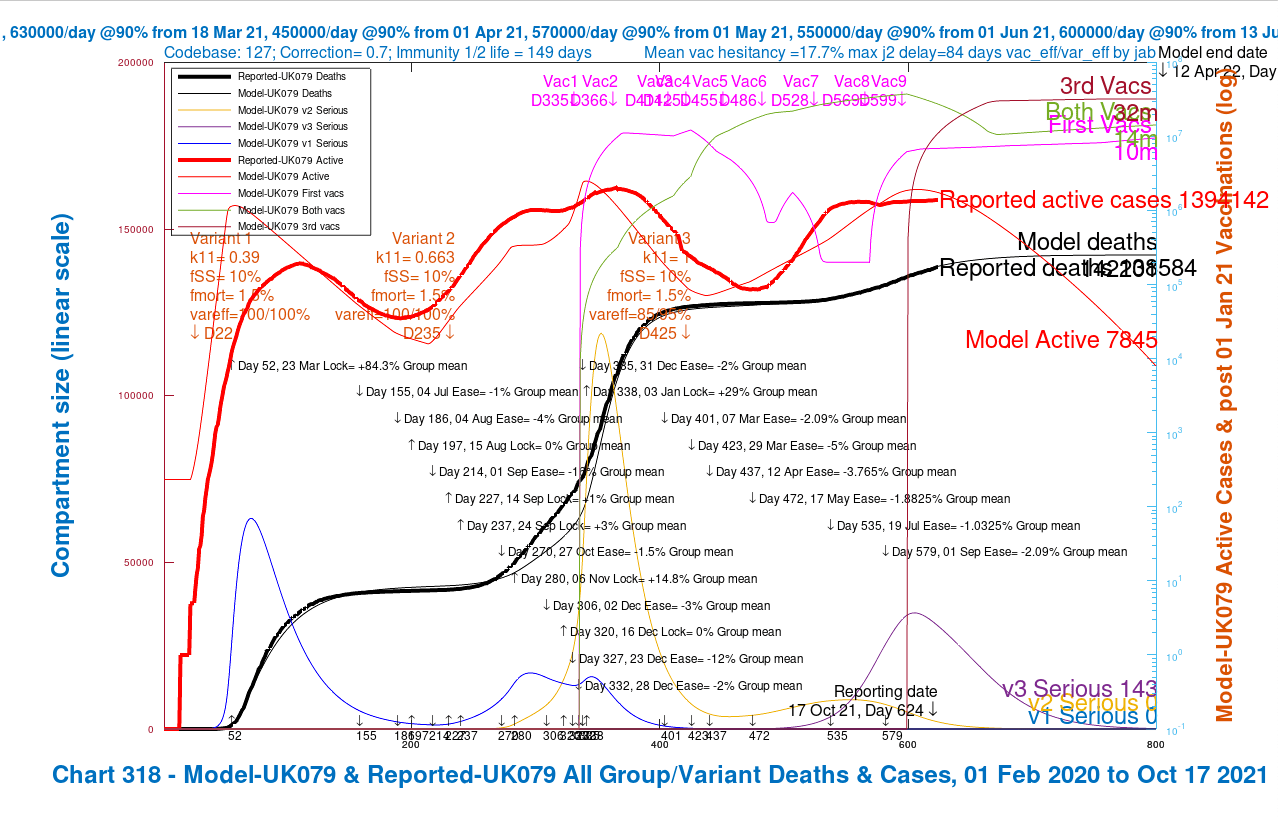
Something odd seems to be happening with the relationship between reported UK Covid-19 cases and deaths in the last few weeks, when deaths have been increasing somewhat more quickly than recently, but cases have declined steeply. My model charts seem to expose this oddity.
Coronavirus booster jab matters
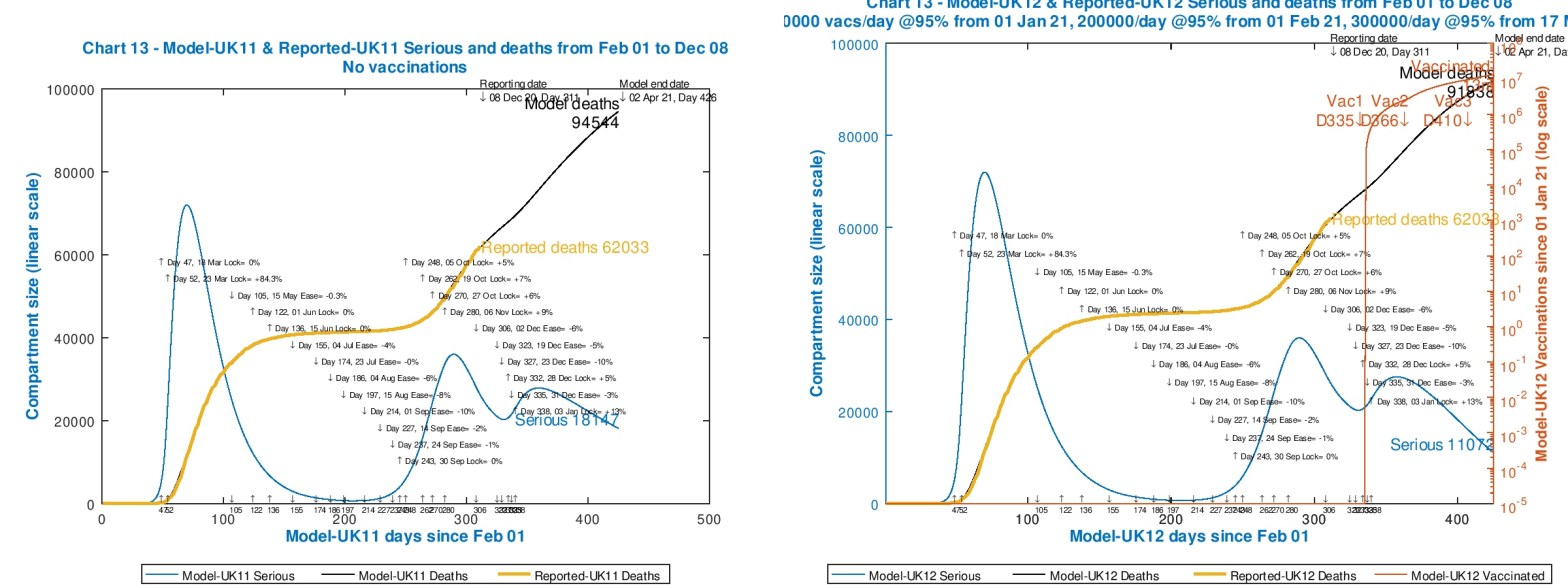
Having just had my 3rd Covid jab, the “booster” jab, it provoked a few thoughts about that, my Coronavirus model, and the wider scene. I had incorporated multiple jabs into my UK model some time ago, and multiple phases for inoculation volumes to cope with the first and second jabs. I am taking this opportunity to report briefly on model outcomes for waning immunity in the context of booster jabs.
USA Thanksgiving Coronavirus lessons for UK Christmas and New Year?
We are aware that the rates of cases and deaths in the USA have increased steeply recently, and it seems that the natural public relaxation in precautions against Covid-19 for the Thanksgiving holiday period have exacerbated this. I have run my model with reductions to the USA intervention effectiveness during the Thanksgiving period (reflecting the increase in travel and social interactions in the USA) followed by reintroduction of the intervention effectiveness afterwards, to see the effect on the immediate projections. I have then applied similar changes to my UK models, to anticipate what the possible effect of such relaxations over the UK festive period might be. This is very much a sensitivity test of some scenarios, not a forecast.
The end of the beginning* – Coronavirus
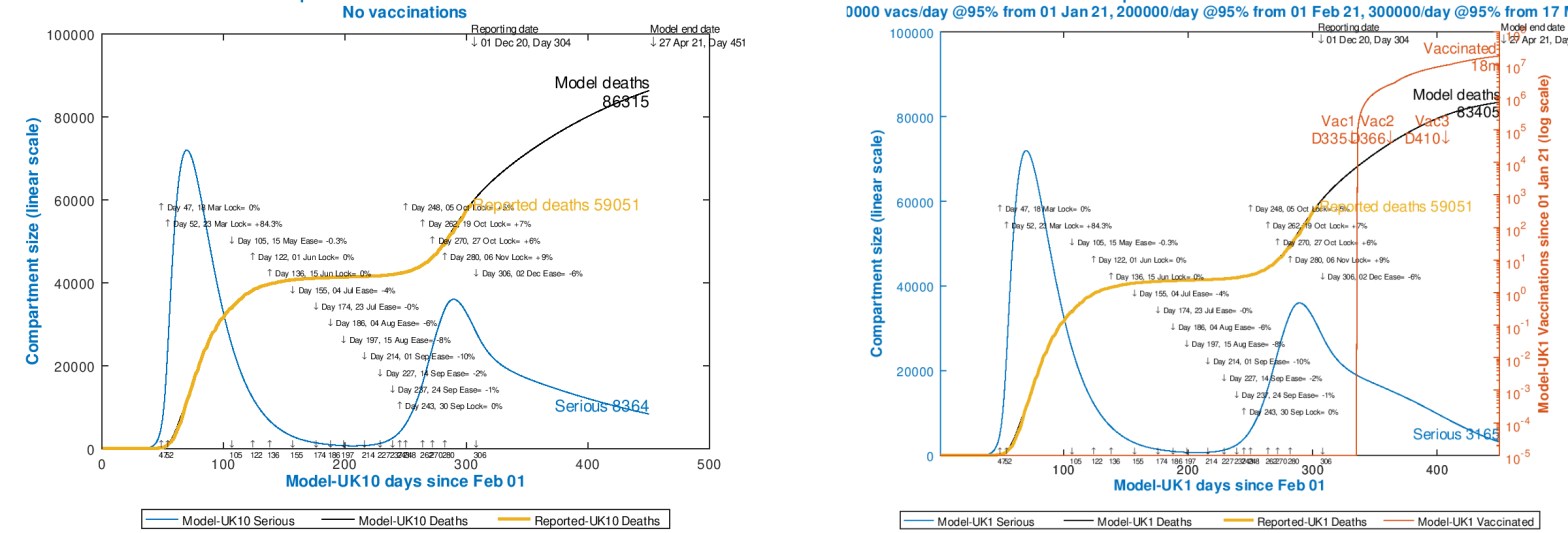
Now that it seems clear that a vaccination programme in the UK might start as early as next week, I have re-run my Covid-19 vaccination model for the UK, updating the November 25th scenarios (which begin on January 1st 2021) to reflect some potential UK outcomes.
Modelling of Coronavirus vaccine strategies
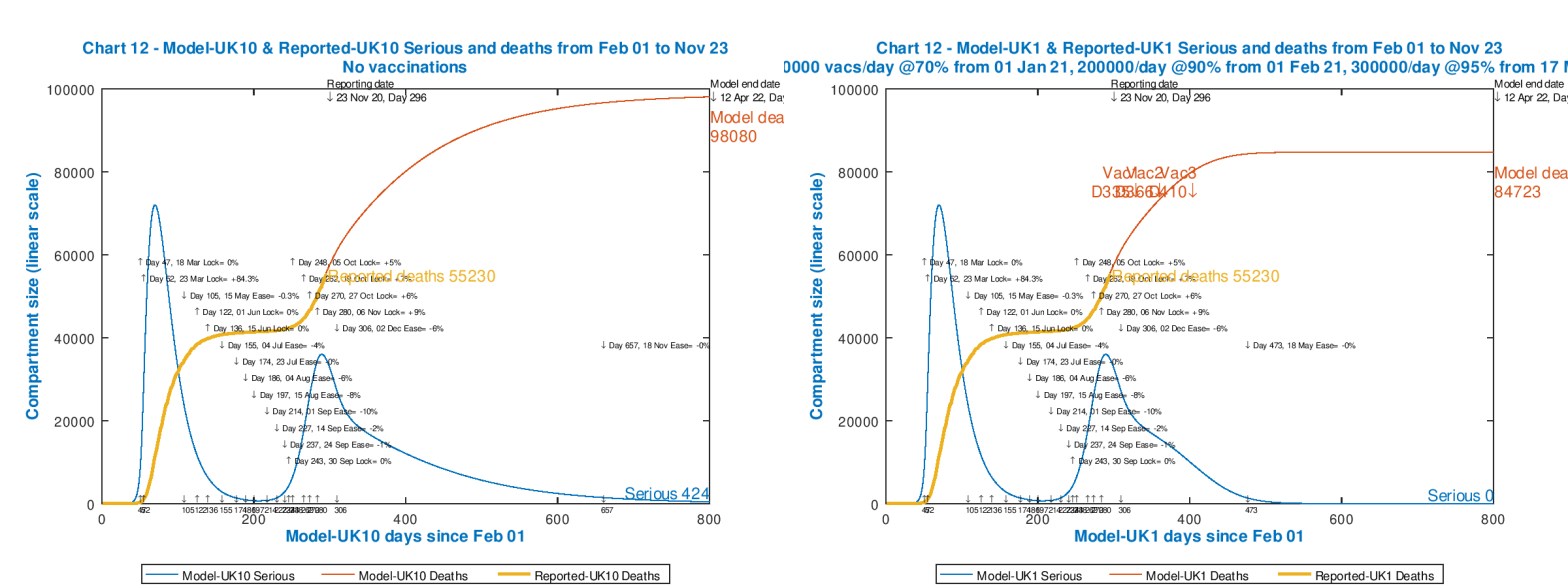
In my most recent post on November 18th, about updating my Coronavirus model to handle the impact of vaccines, I gave some examples of how case numbers, and more specifically death rates might be improved for the UK through a vaccination programme. Now that there seem to be several vaccines imminent, with efficacies ranging from 70% (Astra-Zeneca/Oxford) through 90% (A-Z/O via a different inoculation regime, and Pfizer), to 95% (Moderna) and several others in the mix, I explore some sensitivities in more detail, and also apply the model to the USA.
My model calculations for Coronavirus cases for an earlier UK lockdown
This post presents the two case number comparisons charts for the 9th March and 23rd March lockdown dates (I had covered the death data in more detail in my previous post on this topic).
