
This article presents two case number comparison charts for the 9th March and 23rd March 2020 UK Coronavirus lockdown dates. I had covered the deaths data in more detail in my previous post on this topic, and add that here too.
Category Archives: Office for National Statistics
My Coronavirus UK model outcomes as ONS reporting comes to an end

The UK Office of National Statistics (ONS) had just announced that it was ceasing publication of the regular cases and deaths outcomes of the UK Covid-19 pandemic, as of 24th March 2023, and then revised all previously published Covid data. I was able to make global changes to most of my model history, by re-working some of the early Variant characteristics in the model. This post reports the outcomes of that work.
The Kraken Wakes* – Coronavirus
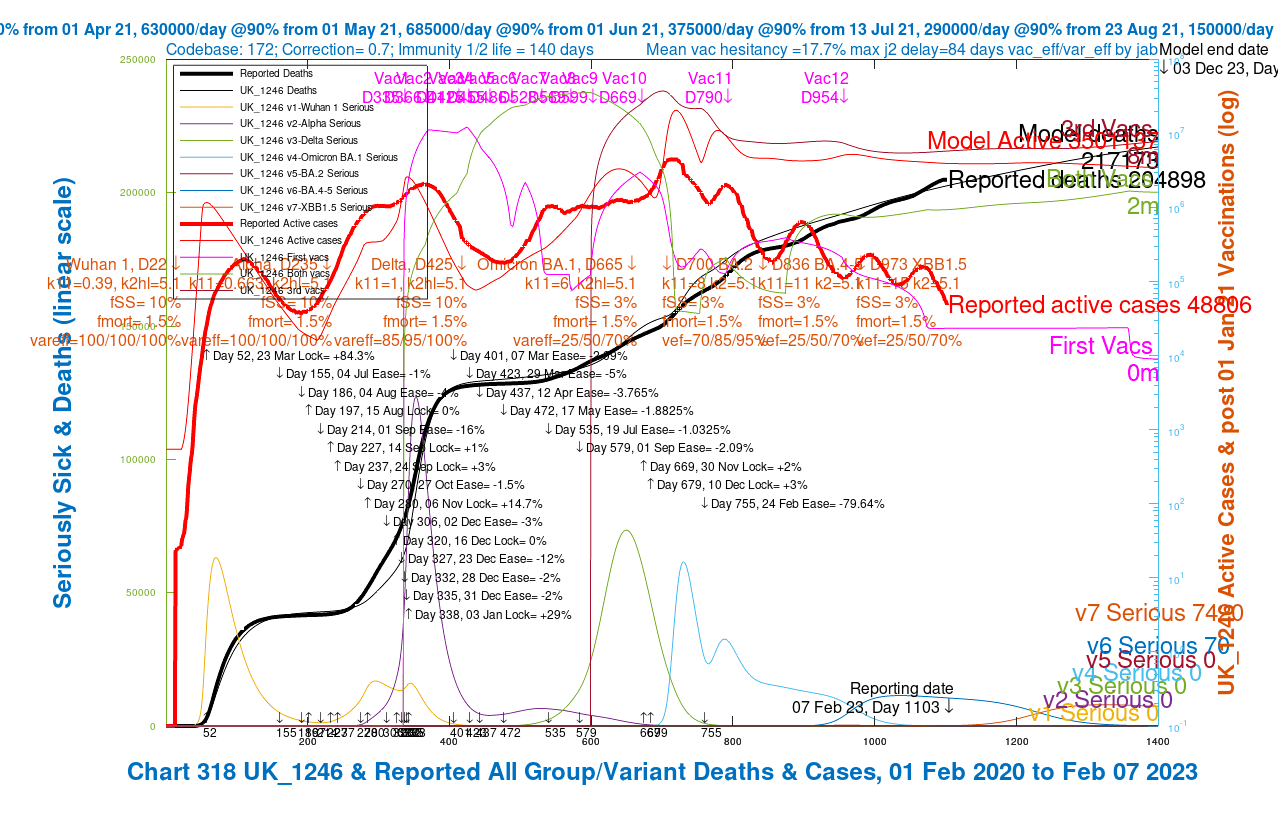
I have continued to improve and run my Coronavirus model daily. The code for the model is now at version 172, and I have added a dataset to represent the variant XBB.1.5, known informally as “Kraken”. The fit of the model to reported deaths is good. I explore in the article the behaviour of Modelled vs. Reported Active Cases.
Declining Omicron cases but increasing deaths – Coronavirus

Something odd seems to be happening with the relationship between reported UK Covid-19 cases and deaths in the last few weeks, when deaths have been increasing somewhat more quickly than recently, but cases have declined steeply. My model charts seem to expose this oddity.
Coronavirus model update following UK revision of Covid-19 deaths reporting
On August 12th, the UK Government revised their counting methodology and reporting of deaths from Covid-19, bringing Public Health England’s reporting into line with that from the other home countries, Wales, Northern Ireland and Scotland. I have re-calibrated and re-forecast my model to adapt to this new basis.
The effect of lockdown easing in the UK – Coronavirus
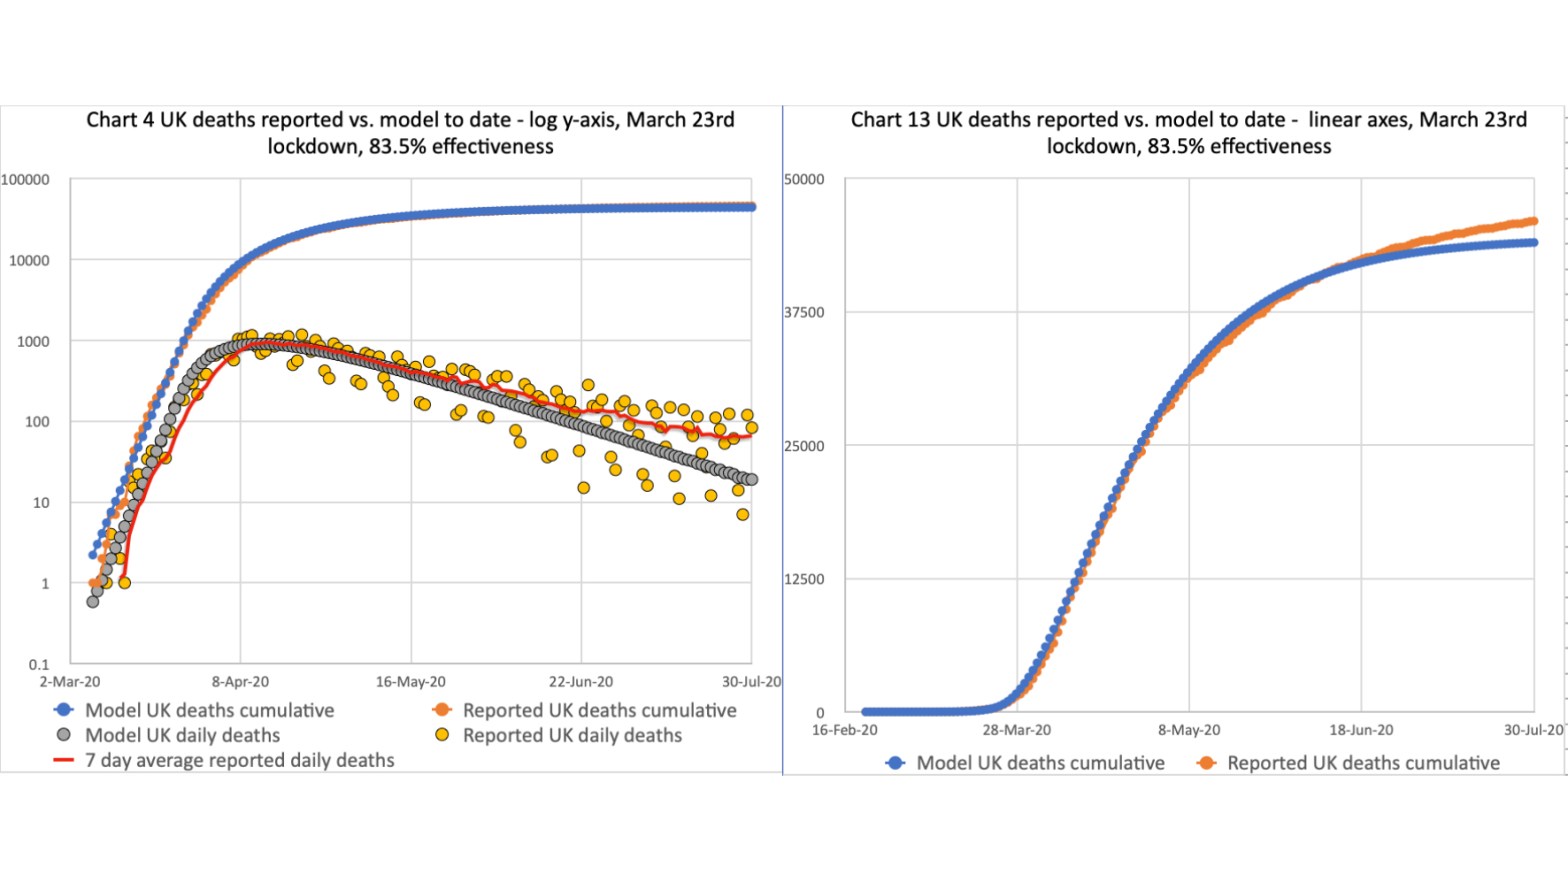
As reported in my previous post, there has been a gradual reduction in the rate of decline of cases and deaths in the UK relative to my model forecasts. This decline had already been noted, as I reported before, by The Office for National Statistics and their research partners, the University of Oxford, and reported on the ONS website.
I had adjusted the original lockdown effectiveness in my model (from 23rd March) to reflect this emerging change, but as the model had been predicting correct behaviour up until mid to late May, I will present here the original model forecasts compared to the current reported deaths trend.
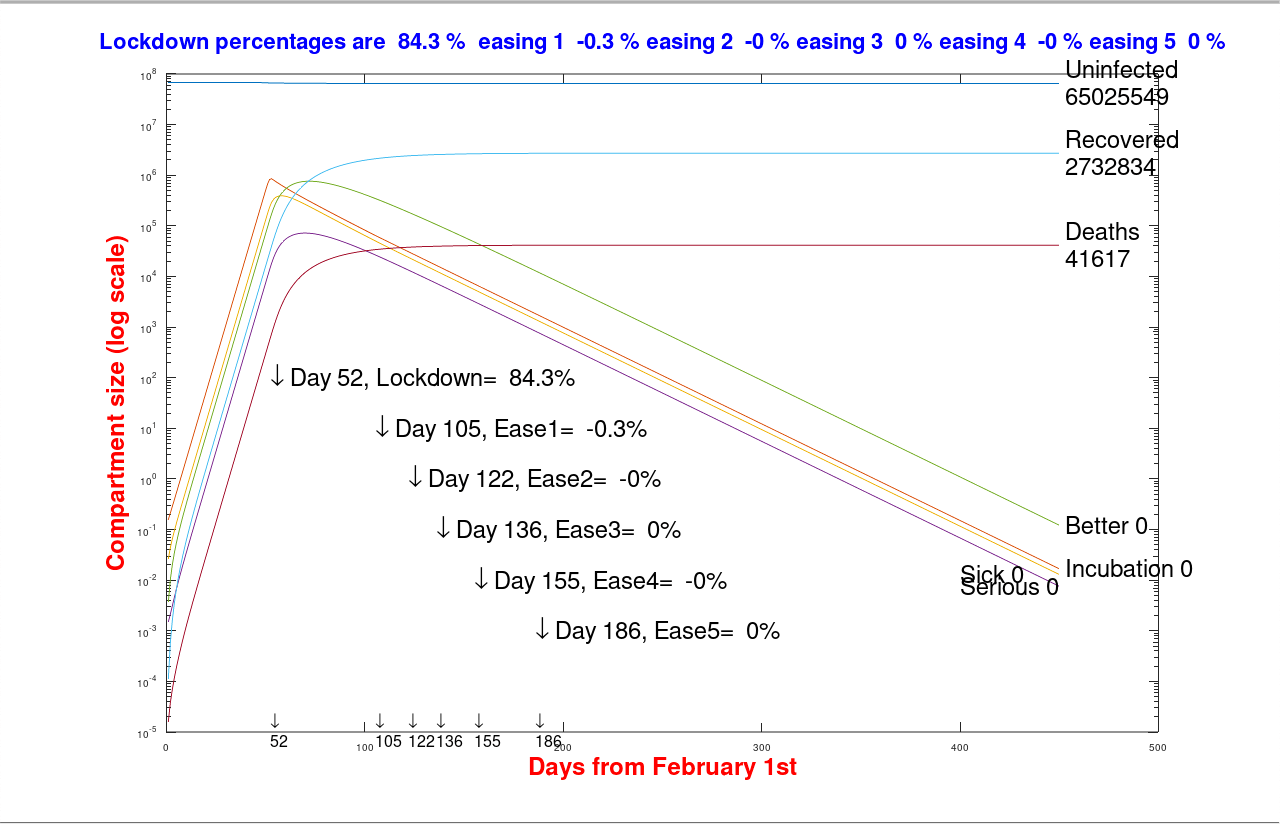
My model calculations for Coronavirus cases for an earlier UK lockdown
This post presents the two case number comparisons charts for the 9th March and 23rd March lockdown dates (I had covered the death data in more detail in my previous post on this topic).
