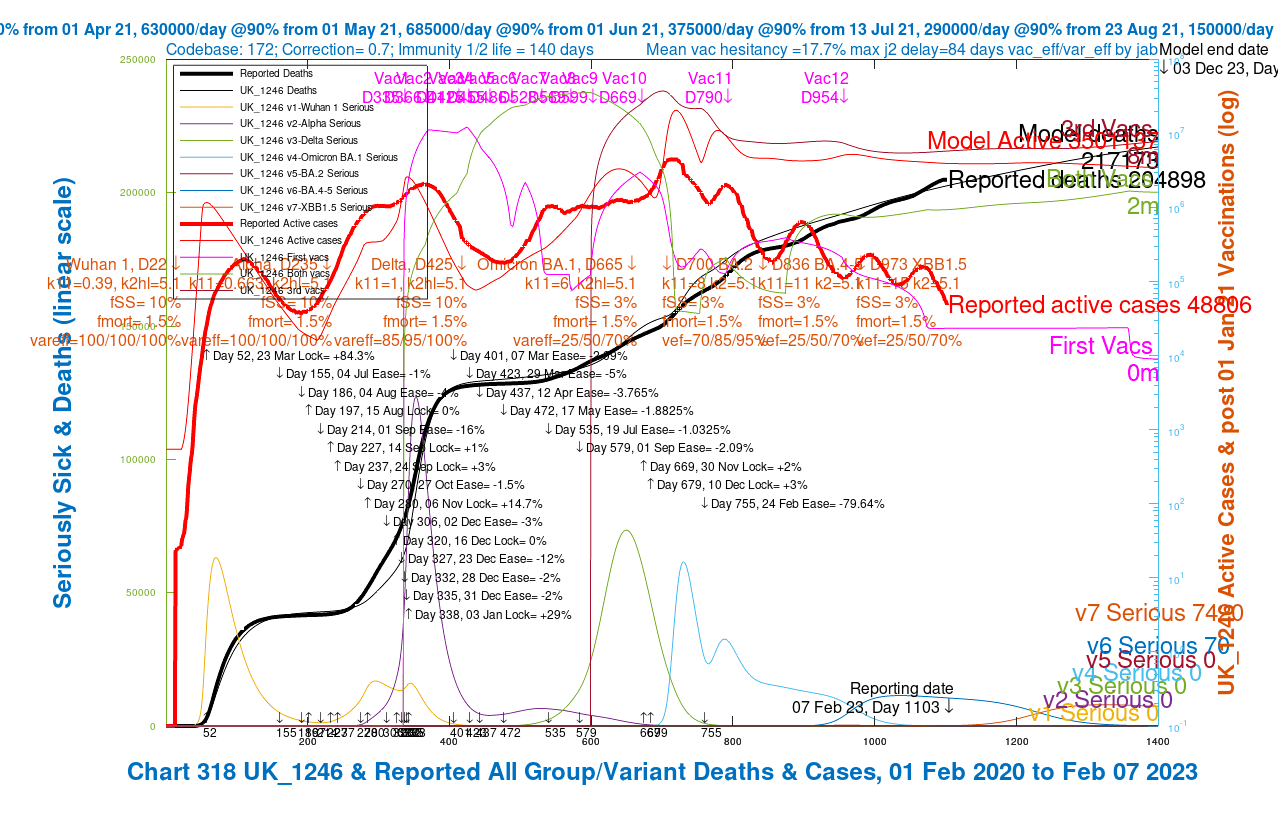
I have continued to improve and run my Coronavirus model daily. The code for the model is now at version 172, and I have added a dataset to represent the variant XBB.1.5, known informally as “Kraken”. The fit of the model to reported deaths is good. I explore in the article the behaviour of Modelled vs. Reported Active Cases.
Author Archives: docbrs
How Zwift helps train for 6Points Ibiza and Formentera

Looking back at our 6Points ride to the 6 Compass points of both Formentera and Ibiza over the weekend of 4/5/6th October
Protected: 20220826 Using Zwift to train for 6Points Ibiza and Formentera
There is no excerpt because this is a protected post.
Protected: 20220808 Using Zwift to train for 6Points Ibiza and Formentera
There is no excerpt because this is a protected post.
Protected: 20220808 Zwift’s 6Points Mallorca as preparation for real-life 6Points
There is no excerpt because this is a protected post.
Protected: Using Zwift’s 6Points Mallorca Training Rides to prepare for real-life 6Points
There is no excerpt because this is a protected post.
Some of my bike rides in Mallorca, Ibiza and Formentera: past, present and future

Here are some bike rides I have enjoyed in the Balearics during the last seven years. I’m looking forward to my first post-pandemic visit in October for the 6Points Ibiza and Formentera, which I last rode in the autumn of 2019, with some additional Mallorca riding before and after. Some of the following rides are on the agenda!
Omicron continues to surprise – Coronavirus

Introduction In my most recent articles on the Omicron variants of Covid-19, I have highlighted the discrepancy between plummeting Active Cases and increasing cumulative Deaths. My model draws attention to this, by comparing the previous alignment of modelled and reported data, prior to February 24th, with the recent divergence. This post continues to summarise theContinue reading “Omicron continues to surprise – Coronavirus”
Declining Omicron cases but increasing deaths – Coronavirus

Something odd seems to be happening with the relationship between reported UK Covid-19 cases and deaths in the last few weeks, when deaths have been increasing somewhat more quickly than recently, but cases have declined steeply. My model charts seem to expose this oddity.
They think it’s all over – but it isn’t – Coronavirus

In this article, I present a few variations of the current model to illustrate some outcomes depending on different assumptions about the current dominant variant, Omicron BA.2; they are fairly consistent in their forecasts over the 1400 day period of the model, from the outset in February 2020 to December 2023, and show that as NPIs are removed, vaccination is what keeps us safe.
