
Introduction
In my most recent articles on the Omicron variants of Covid-19, I have highlighted the discrepancy between plummeting Active Cases and increasing cumulative Deaths.
My model draws attention to this, by comparing the previous alignment of modelled and reported data, prior to February 24th, with the recent divergence. This post continues to summarise the position.
Omicron variants, especially the latest BA.4 and BA.5 ones, are not yet fully understood. How much more (or less) virulent they are than the previous dominant BA.2 variant is unclear to me – I see conflicting opinions on this.
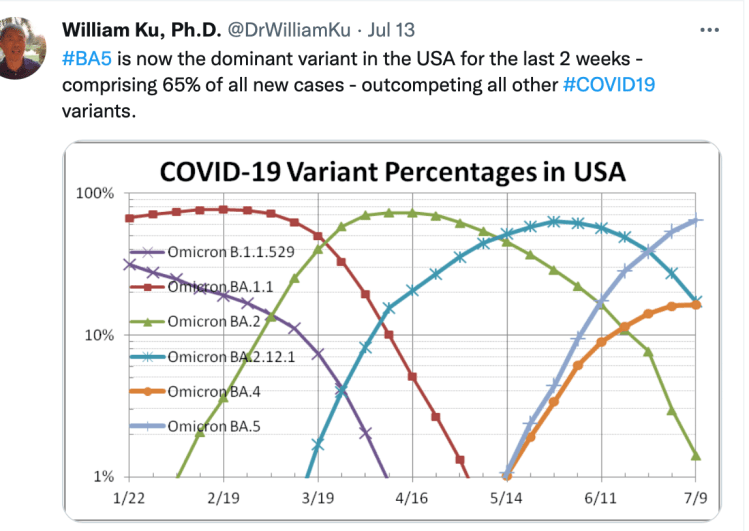
As Dr William Ku says in his tweet below, #BA5 is now the dominant variant in the USA for the first 2 weeks of July – comprising 65% of all new cases – out-competing all other #COVID19 variants, which he shows in this chart.
It may well be that my model requires attention, in order to reflect the behaviour, but given the scientific uncertainty, I have not yet worked out, as I run sensitivity cases in the model, whether the issue is an underlying change in Omicron‘s behaviour, or my failure to reflect Omicron‘s complexity in the model.
In any case, I report here several recent runs of the model to illustrate the issue.
Model views
As I said last time, in my May 6th report, modelled Active Cases and Deaths were in line with reported UK Data until about mid-March 2022. But from that time, until about mid-May, reported cumulative Deaths increased proportionately more quickly than before, whereas reported Active Cases dropped steeply.
This divergence can be seen in the heavier red and black curves on all of the charts, representing the reported data, as shown in this excerpt from Chart UK_1196. The full chart can be seen later on, but each of my charts, for the different scenarios, show a similar temporary divergence.
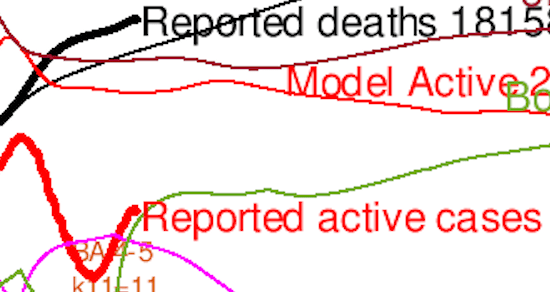
Even allowing for the lag between the reported Active Case rate decline and its effect on the reported Death rate, this contradictory behaviour is very odd.
This is not a model observation, but a feature of the public Coronavirus statistics reported by the UK Government’s ONS (Office for National Statistics). The model helps draw attention to it, since the progress of the pandemic in the model was, both before and after that period, similar to what had happened in the real world.
In the model, after this period, the modelled cumulative deaths once again parallel the reported deaths (although at about 5,000 less, about a 2.5% difference), with the reported and modelled Active Case rates getting a little closer.
But in that two-month period, reality diverged from simulation!
Charts for different NPIs, virulence and mortality
First I will show model scenario UK_1090 where NPIs (Non-Pharmaceutical Interventions) reduced by 50% on February 24th, and then compare that with scenario UK_1091, with all model NPIs removed.
It’s important to understand that in the model, NPIs are the combination of Government measures and public responses. The 50% removal of model NPIs allows for the likelihood that some people will exercise all the freedoms they are allowed, whereas others might (like me) continue to be cautious. The effect of NPIs on virus transmission is only as good as the public’s response to them.
BA.4 and BA.5 increased, NPIs reduced by 50%
Here is the model chart UK_1090, with parameters set as listed in the captions and in the body of the chart itself, with increased Omicron BA.4 and BA.5 virulence and mortality compared with BA.2, which in the model remains as it was for my previous reports.
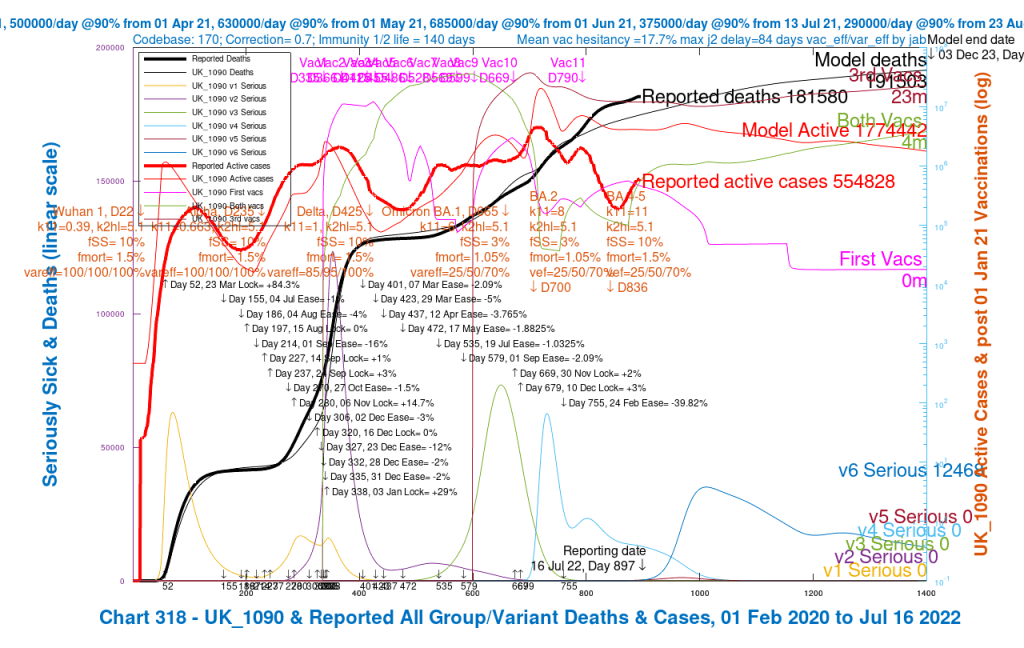
The chart shows NPIs reduced to half what they were before February 24th, when the UK Government removed all legal requirements for Covid-19 mitigations. This appears as a reduction of -39.82% in the chart. This will have the effect of increasing the transmission rate of any variants present after February 24th, e.g. Omicron BA.4 and BA.5, which appear on Day 836 in the model, May 17th 2022.
Omicron BA.2, which arrived on January 1st 2022, Day 700 in the model, is initially unaffected by this NPI change, prior to Feb 24th, but will have higher transmission rate after that date.
I didn’t remove all NPIs for this scenario, which reflects that many people (like me) are still taking more care to be socially distanced where practical and sensible, and to wear masks in crowded indoor or public transport situations (although many do not).
My model NPIs were at an average of +79.64% before this (an average across age groups), meaning that NPIs had the effect (in the model) of reducing virus transmission to 20.36% of what it would have been with no NPIs.
Zero NPI reduction, BA.4 and BA.5 increased
In the following chart UK_1091, I show the outcomes for NPIs as they would have been if no reduction to them had been made on February 24th. I mention again that in the model, NPIs are the combination of Government measures and public responses, and so the assumption in this scenario is that public behaviour didn’t change either.
In chart UK_1091, we see that Active cases and Deaths are much reduced when the previous NPIs are left in place, compared with the 50% reduction in NPIs in UK_1090.

Omicron variants BA.4/5, with fSS=10% and fMORT=1.5%, have higher virulence and mortality than BA.1 and BA.2, each with fSS=3% and fMORT=1.05% in this scenario.
Model charts for BA.2 changes
In the following charts, I increase the virulence and mortality for Omicron BA.2 to the same increased levels as for BA.4 and BA.5 to see the effect in the model. In effect, these are parametric run to assess sensitivities; the charts are otherwise the same as the ones above.
NPIs reduced by 50%, with BA.2 virulence and mortality also increased
In this first chart UK_1089, with 50% of the NPIs removed on February 24th, we see only small increases in Active cases and cumulative Deaths compared with the first case above, where only Omicron BA.4/5 had the higher virulence and mortality.
In my opinion, with experience of running the model prior to January 2021, when vaccination was first introduced in the UK, the presence of vaccination tends to damp down increases we might otherwise have seen.

NPIs remain, with no Feb 24th reduction, BA.2 virulence and mortality increased
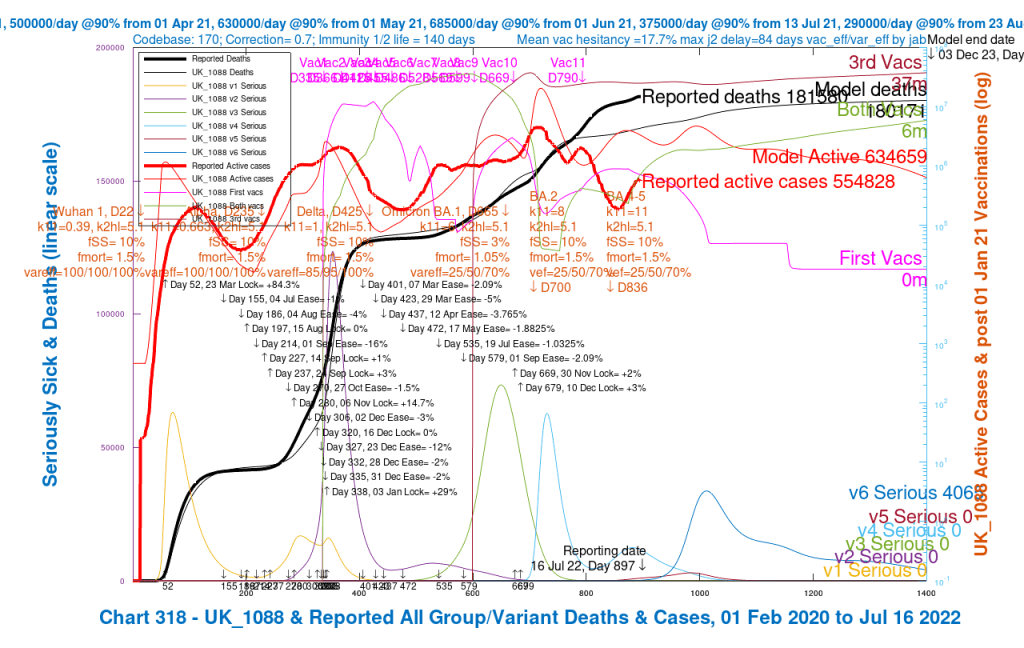
This scenario UK_1088, with previous NPIs remaining, again shows a large reduction in Active cases and cumulative death rates, compared with the preceding, February 24th NPI reduction case UK_1089, with all Omicron variants postulated to have higher virulence and mortality. Active cases are similar to the UK_1091 case, with 138 more deaths, less than a 1% increase.
All NPIs removed, BA.2 virulence and mortality as for BA.4/5
Finally, I show the scenario UK_1196 with all NPIs removed, a change of -79.64%, which removes the cumulative NPIs of 79.64% as they stood just prior to February 24th, with Omicron BA.2 having the same virulence and mortality as BA.4/5. Click here to return to the detailed extract from this chart, highlighting the divergence between Active Case and Death rates.

Summary outcomes
The following table summarises the different model outcomes for Active Cases and cumulative Deaths by Day 1400 in the model, December 3rd, 2023, for all five scenarios.
In all modelled scenarios, Omicron BA.4/5 has virulence fSS = 10% and mortality fMORT = 1.5%. Virulence and Mortality for Omicron BA.2 varies in the different scenarios, as a sensitivity test, as shown below.
We can see from the table that UK_1196 is a worst-case scenario (of those shown), with UK_1088 and UK_1091 as best cases.
UK_1089 and UK_1090 might be more realistic scenarios, because as far as the effect of NPIs and public behaviour are concerned, although legal backing for NPIs was removed in the UK on February 24th, I think many people, especially the mid-age to older groups, are still being cautious when they can.
If so, it might well be a good estimate that the combined effect of NPI reduction on the one hand, but with sustained public caution on the other, is about half what it had been before – i.e. reducing the aggregate 79.64% NPI effectiveness, that had been in the model just prior to February 24th, down to 39.82%, half what it was.
| Day 1400 outcomes | UK_1088 | UK_1089 | UK_1090 | UK_1091 | UK_1196 |
| BA.2 Virulence measure, fSS | 10% | 10% | 3% | 3% | 10% |
| BA.2 Mortality measure, fMORT | 1.5% | 1.5% | 1.05% | 1.05% | 1.5% |
| February 24th NPI reduction? | No | -39.82% | -39.82% | No | -79.64% |
| NPI effectiveness from Feb 24 | 79.64% | 39.82% | 39.82% | 79.64% | 0% |
| Active Cases, Day 1400 | 634,659 | 1,774,450 | 1,774,442 | 634,759 | 2,378,276 |
| Deaths, Day 1400 | 180,171 | 191,690 | 191,503 | 180,033 | 195,320 |
In this table, NPI reduction at -79.64% means that as of February 24th 2022, all NPIs and public cautionary behaviour are removed from the model.
A reduction of -39.82% means that the combined effect of NPIs and public behavioural caution is reduced to half what it had been just prior to February 24th.
Discussion
We can see that Active Cases and Deaths outcomes in UK_1089, UK_1090 and UK_1196 are far higher with the reductions in NPIs on February 24th in those three scenarios. The Active Cases and Deaths across all scenarios are essentially correlated with the extent of NPI effectiveness reductions, which do differ substantially across the different scenarios.
One surprising observation from the table is that changes in virulence and mortality settings, as between UK_1088 and UK_1091, and also as between UK_1089 and UK_1090, make little difference to outcomes.
My interpretation, as mentioned before, is that the prevailing background of high vaccination levels in the UK seems to dampen down the effects of such changes.
Because a dominant characteristic of Omicron is its very high transmission rate compared with earlier variants, perhaps relatively smaller changes in virulence and mortality are dominated by these other factors of high transmission rates and high rates of vaccination, varying somewhat by age group.
Prior to December 2020, in the absence of vaccination, NPIs were essentially performing the role, the difference being that vaccination eventually allowed the UK population to return to more normal working and socialising lives.
I know from all my previous work, especially just before and just after when vaccination started in the UK, just prior to New Year 2020/21, that if I were to run today’s model with no vaccination, the model’s Cases and Deaths numbers would skyrocket. The outcomes for NPI reduction or removal are only as good as they are because of vaccination.
Concluding comments
The difficulty in adjusting my model’s parameters to reflect the rising Death rates but relative decline and/or much lower growth in Active Cases is that the mortality of Omicron BA.4/5 (and possible BA.2) would need to be changed in the model; but I see no clear scientific justification for that (yet).
One of the research difficulties, post-vaccination, is assessing underlying virus characteristics and behaviour, taking into account the influences of vaccination, as well as other contextual changes, including subtle changes in human responses.
I will, therefore, leave the parameters as they are for the time being, and continue to monitor this discrepancy, focusing on datasets UK_1089 and UK_1090, since they are relatively more accurate in most respects than other datasets. I will retain UK_1196 as a worst-case scenario, with its high virulence and mortality, and with all NPIs removed, always keeping in mind that vaccination is present at high levels in all of these scenarios. That is what keeps the UK safe.
The rate of increase in modelled cumulative Deaths from about mid-May in all model scenarios is about the same as reported rates, albeit starting at a slightly lower base. I expect the model to converge towards observed data. We shall see.
It also remains to be seen if the Active Case rates also return to a rate more consistently proportional to the Death rate, as it was before March. If not, one wonders if UK case rates are not measured or reported completely and/or accurately, despite the UK Government’s ONS regular random sampling of over 100,000 people, which should be more accurate than voluntary self-reporting.
Appendix (added 24th July 2022)
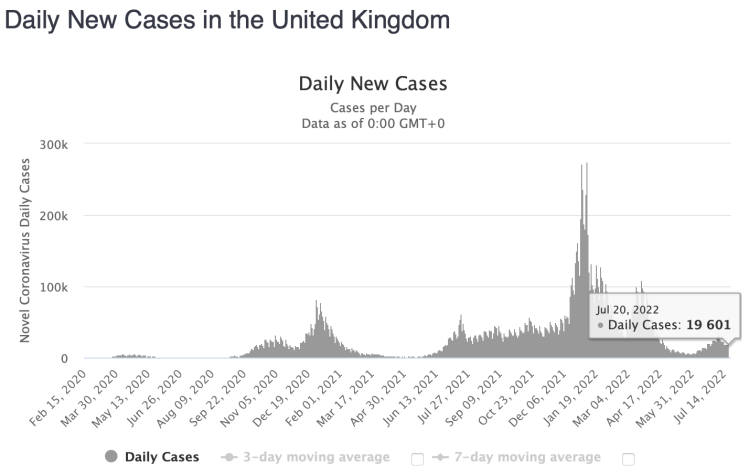
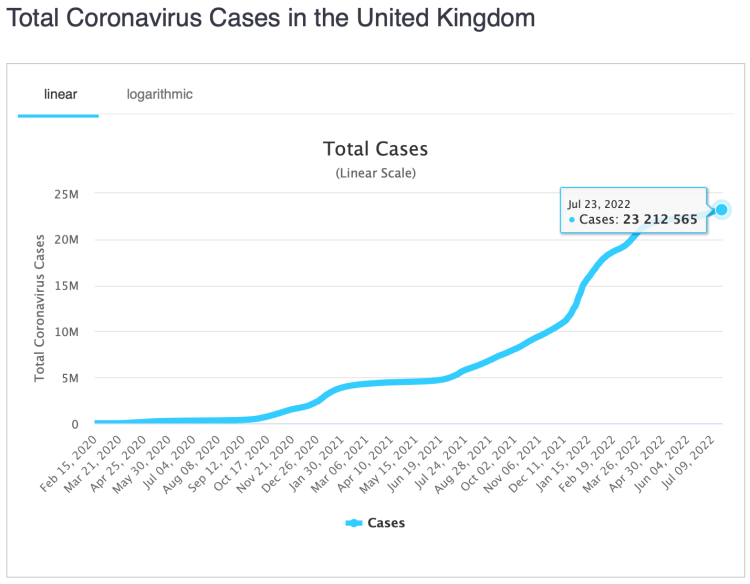
I draw the data for my charts from Worldometers UK, and I present below a slideshow of their own charts for reference, although the charts are from late July rather than mid-July.
They are totally consistent with the data presented in this blog post, unsurprisingly, since my data is drawn from Worldometers, who in turn source their data from the UK ONS data. I find it easier to benefit from Worldometer’s sourcing from the ONS (UK Office for National Statistics) since their work does part of the sourcing job for me!
The five presentations cover daily deaths and cases; active cases; and cumulative deaths and cases.


One thought on “Omicron continues to surprise – Coronavirus”