Summary
This is an update to my June 1st and May 24th analyses of what Government and their advisers might be seeing in their modelling about the new Delta variant (the “India” variant, v3 in my model), and the outlook for lockdown relaxation. As always, my models are my developments of a model first created by Prof Alex de Visscher, Concordia University, Montreal.
Having explored what pandemic advisers might be seeing and highlighting to decision-makers in Government, I run scenarios with different settings for the planned June 21st relaxation of lockdown, the last in the series of relaxations over the first half of 2021, following the January 3rd lockdown.
These model scenarios show the relative consequences of the June 21st relaxation as planned, versus five other options:- cancellation of the June 21st step altogether; three different delays, of 14, 28 and 56 days; and then a 50% reduction in the scope of the originally planned June 21st relaxation. Finally I mix these strategies, with 50% reduced NPI relaxation as well as delays, to offer three further options.
The scenario outcomes indicate the importance of the UK vaccine programme, as we face a variant with potentially different characteristics of transmission, severity of infection, mortality and responsiveness to vaccines.
None of the options has zero impact on serious illness and deaths, although whatever is decided for June 21st, further actions would undoubtedly be taken if infections, hospitalisations and/or deaths were to show further signs of steep growth.
I don’t yet speculate on what those further actions might be, and so the options and scenarios here represent worst cases, and are not forecasts of realistic outcomes. They are sensitivity projections to show the relative outcomes of nine different strategies for the planned June 21st lockdown relaxation, each with four different assumptions about the nature of variant v3 in the model.
Introduction to the Options and Scenarios
Initially I ran six sets of model options A, B, B2, C, D and E, each with four scenarios that explore a range of variant v3 setting options, to represent different assumptions about the virulence, mortality and resistance to vaccines of a third model variant v3, modelling different potential characteristics of the India “Delta” variant, starting on April 1st 2021.
The first set of four scenarios, option A, includes all of the NPIs (Non Pharmaceutical Interventions) made up to May 17th 2021, without the intended one for June 21st.
The second set of scenarios, Option B, include the June 21st NPI as planned.
Options B2, C and D repeat the same four variant v3 scenarios, but with delays of the planned June 21st NPI relaxation by 14, 28 or 56 days, to July 5th, July 19th or August 16th respectively.
Option E retains the June 21st date, but with a reduction of 50% of the originally planned NPI relaxation, reflecting another possible UK Government action – reduced NPI relaxation instead of delay.
Subsequently I have added Options F, G and H to present some mixed scenarios, each with 50% reduced NPI relaxations, combined with delay by 14, 28 and 56 days respectively from the originally planned June 21st.
All scenarios in all Options include the full UK vaccination programme as represented in the model in my previous post(s).
Introduction to the variant v3 settings
In all sets of Option charts, I vary the settings for the model variant v3 (representing the India (now denoted the “Delta”) variant, introduced to the model on April 1st 2021) with four different combinations of 30% higher v3 virulence & mortality (or not); and v3‘s tendency to escape vaccines (or not). Variant v3‘s degree of escape from vaccines is implemented as a percentage efficacy coefficient (var_eff) of the prevailing efficacy of vaccines vac_eff against variants v1 and v2.
var_eff = 100% when variant v3‘s susceptibility to vaccines is the same as for variants v1 and v2, and var_eff = 70% is when vaccine efficacy against it is postulated to be 30% lower.
All of the details of these parameters in the model are described in my previous post, so here I will just summarise the settings.
In all scenarios in all options, the transmission (infection) rate k11 of the third variant v3 is set at 50% more than for v2 (the “Kent” variant, now denoted the “Alpha” variant), equivalently ~2.5 times that of variant v1. I don’t change that between scenarios and Options because most evidence points to a much higher infection rate for the Delta variant.
Variant settings in all Options
I mention here the four scenarios in each of nine Options A, B, B2, C, D, E, F, G and H that use the same variant settings in their scenarios.
| Model scenarios | Variant v3 | v1 k11 | v2 k11 | v3 k11 | v1/v2 fSS | v1/v2 fmort | v3 fSS | v3 fmort | v1/v2 var_eff | v3 var_eff |
|---|---|---|---|---|---|---|---|---|---|---|
| UK482/486/496 UK472/476/462 UK466/472/476 | Base | .39 | .663 | 1.0 | 10% | 1.5% | 13% | 1.95% | 100% | 70% |
| UK483/487/497 UK473/477/463 UK467/473/477 | low vir mort | .39 | .663 | 1.0 | 10% | 1.5% | 10% | 1.5% | 100% | 70% |
| UK484/488/498 UK474/478/464 UK468/474/478 | high var_eff | .39 | .663 | 1.0 | 10% | 1.5% | 13% | 1.95% | 100% | 100% |
| UK485/489/499 UK475/479/465 UK469/475/479 | both | .39 | .663 | 1.0 | 10% | 1.5% | 10% | 1.5% | 100% | 100% |
In the first group of nine variant v3 scenarios, one from each of the nine Options, (in the first row of the table above) the third model variant v3 has the most dangerous characteristics of any of the four variant scenarios: both 30% higher virulence fSS and mortality fmort, and also 70% efficacy coefficient of vaccines against it, var_eff, compared with the previous variants v1 and v2.
In the second group of nine scenarios, the virulence and mortality is reduced, but the var_eff vaccine compliance setting remains at 70%.
The vaccine compliance increases to 100% in the third group of nine scenarios, but the virulence fSS and mortality fmort return to 30% higher than for variants v1 and v2.
Finally, in the fourth & last group of nine scenarios, both of these changes are made, so that apart from its extra transmission rate, other variant v3 parameters virulence fSS, mortality fmort and vaccine compliance var_eff are the same as for variants v1 and v2. This last group of scenarios represents the least dangerous characteristics for variant v3 in the model.
The variant v3 infection transmission rate k11 is unchanged throughout.
Option settings for the planned June 21st 2021 NPI
The dates and settings for NPIs in the model scenarios are tabulated in the body of all of the charts. All Options have all of the NPIs up to and including May 17th 2021. Option A has no subsequent NPIs.
Option B adds the planned NPI relaxation on the scheduled June 21st, and Options B2, C and D delay this NPI relaxation by 14, 28 and 56 days respectively. Option E retains the June 21st date, but the NPI is set at 50% of its planned relaxation. Later Options F, G and H mix these settings. The differences between the Options are summarised in the table below.
| Option | June 21st NPI change | NPI Day | NPI date | NPI % |
|---|---|---|---|---|
| A | last NPI May 17th | – | – | zero |
| B | base, none | 507 | June 21st | -4.13% |
| B2 | 14-day delay | 521 | July 5th | -4.13% |
| C | 28-day delay | 535 | July 19th | -4.13% |
| D | 56-day delay | 563 | August 16th | -4.13% |
| E | 50% NPIs, June 21st | 507 | June 21st | -2.065% |
| F | 50% NPIs, 14-day delay | 521 | July 5th | -2.065% |
| G | 50% NPIs, 28-day delay | 535 | July 19th | -2.065% |
| H | 50% NPIs, 56-day delay | 563 | August 16th | -2.065% |
Option A outcomes with NPI relaxations limited to May 17th 2021
In the 4-slide slideshow below, for scenarios UK486, UK487 UK488 and UK489, I show the changes in outcomes as variant characteristics are ameliorated in steps, from UK486 with the most harmful settings, to UK489 with the least harmful. Settings for the variants are tabulated in the table above, and also in all charts. (NB the automatic change of left y-axis scale in the fourth chart, as the deaths outcome is less than 140,000.)
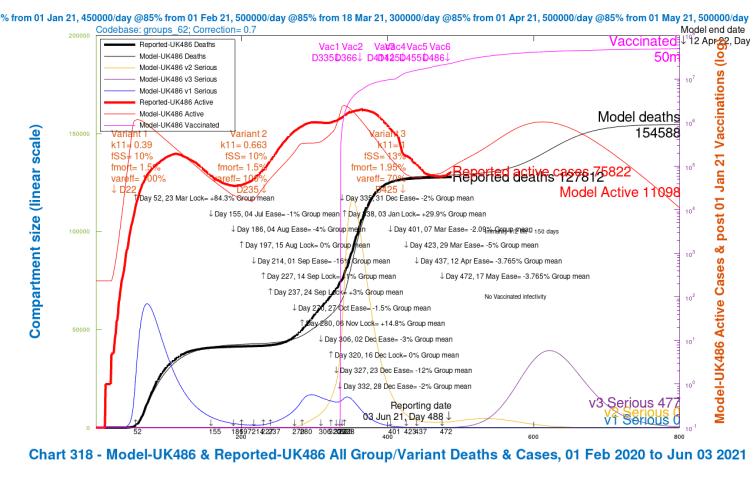
Chart 318 for scenario UK486 with vaccinations and 2021 NPI relaxations up to May 17th. v3 transmission k11 = 1, var_eff = 70%, fss and fmort +30%. Modelled 800 day outcomes to April 12th 2022 compared with reported active cases and deaths to June 3rd. Serious cases for three variants. 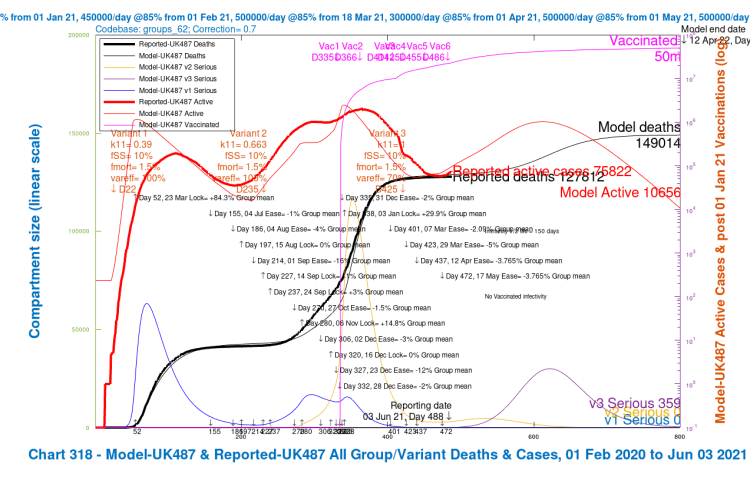
Chart 318 for scenario UK487 with vaccinations and 2021 NPI relaxations up to May 17th. v3 transmission k11 = 1, var_eff = 70%, fss and fmort as for v1 and v2. Model 800 day outcomes to April 12th 2022 compared with reported active cases and deaths to June 3rd. Serious cases for 3 variants 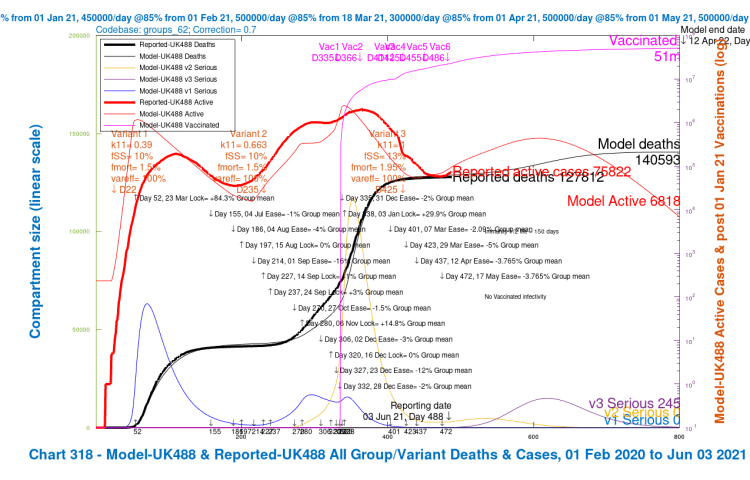
Chart 318 for scenario UK488 with vaccinations and 2021 NPI relaxations up to May 17th. v3 transmission k11 = 1, var_eff = 100%, fss and fmort +30%. Modelled 800 day outcomes to April 12th 2022 compared with reported active cases and deaths to June 3rd. Serious cases for three variants. 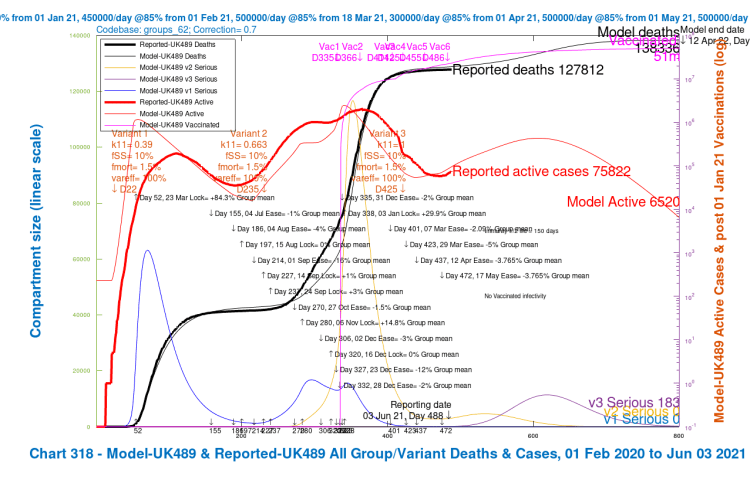
Chart 318 for scenario UK489 with vaccinations and 2021 NPI relaxations up to May 17th. v3 transmission k11 = 1, var_eff = 100%, fss and fmort as for v1 and v2. Model 800 day outcomes to April 12th 2022 compared with reported active cases and deaths to June 3rd. Serious cases for 3 variants
We see that the greater improvements in the outcomes are when the third variant v3‘s ability to escape the vaccine is reduced to zero (var_eff = 100%), so that overall vaccine efficacy to the variant v3 is the same as for variants v1 and v2, at 85%.
[NB the vac_eff vaccine efficacy for the previous variants v1 and v2 is 70% in January and 85% in vaccination phases thereafter, from February 1st onward. Thus if var_eff = 100% for variant v3, the vaccine efficacy against it is vac_eff x var_eff = (.85 x 1)x100% ≈ 85%, since it arrives into the model on April 1st when the base vaccine efficacy vac_eff is 85%, the same as for the previous variants. When var_eff = 70% for variant v3, the overall vaccine efficacy against it is (.85 x .7)x100% ≈ 60%.]
Reductions in virulence (fSS) and mortality (fmort) of variant v3 back to the v1 and v2 settings do improve the situation, but not by so much as increasing the vaccine’s efficacy against variant v3, for the differences of ±30% that were applied to both settings.
We also see the peak in people becoming Seriously Sick from variant v3 (the purple “v3 serious” curve) reducing as variant v3 is made successively less dangerous in the four scenarios.
Option B outcomes with all NPI relaxations to June 21st 2021
Contrast the Option A above with the following equivalent charts for Option B below, the scenarios where the UK Government’s planned relaxation for June 21st is added. These are scenarios UK482, UK483, UK484 and UK485.
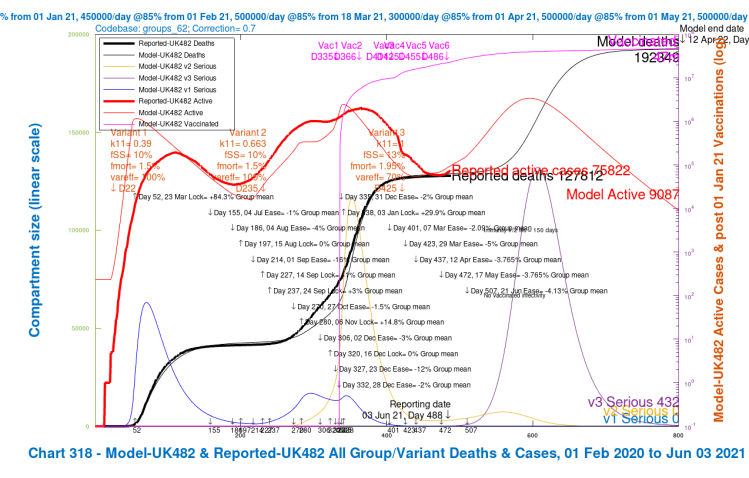
Chart 318 for scenario UK482 with vaccinations and 2021 NPI relaxations up to June 21st. v3 transmission k11 = 1, var_eff = 70%, fss and fmort +30%. Modelled 800 day outcomes to April 12th 2022 compared with reported active cases and deaths to June 3rd. Serious cases for three variants. 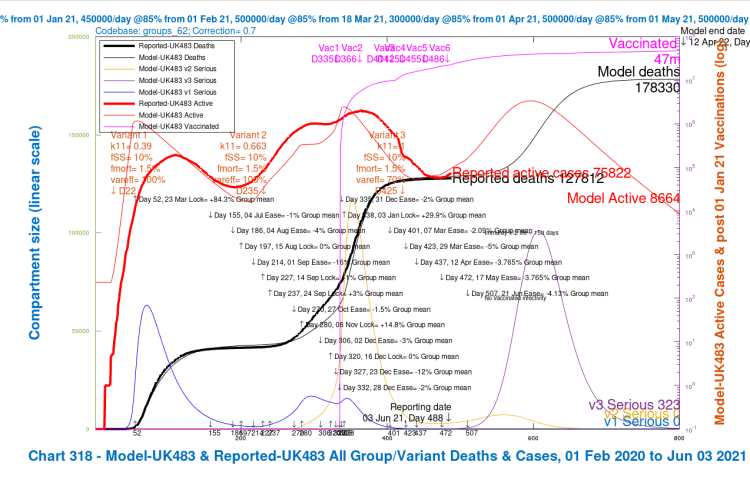
Chart 318 for scenario UK483 with vaccinations and 2021 NPI relaxations up to June 21st. v3 transmission k11 = 1, var_eff = 70%, fss and fmort as v1 and v2. Model 800 day outcomes to April 12th 2022 compared with reported active cases and deaths to June 3rd. Serious cases for 3 variants 
Chart 318 for scenario UK484 with vaccinations and 2021 NPI relaxations up to June 21st. v3 transmission k11 = 1, var_eff = 100%, fss and fmort +30%. Modelled 800 day outcomes to April 12th 2022 compared with reported active cases and deaths to June 3rd. Serious cases for three variants. 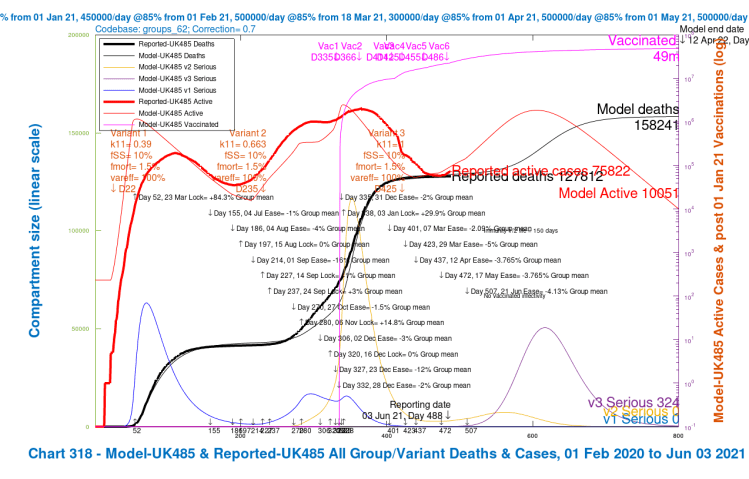
Chart 318 for scenario UK485 with vaccinations and June 21st 2021 NPI relaxations. v3 transmission k11 = 1, var_eff = 100%, fss and fmort as fort v1 and v2. Model 800 day outcomes to April 12th 2022 compared with reported active cases and deaths to June 3rd. Serious cases for 3 variants
The first thing to see is that all of these option B scenarios have worse outcomes than all of those in Option A, which isn’t entirely unexpected, although overlap in the outcomes would certainly have been possible in principle, with different specific parameters for the scenarios.
Once again, as with Option A, the greater improvements within Option B arise when the vaccination efficacy coefficient var_eff against variant 3 is restored to 100%. Reductions in its virulence and mortality (from 30% higher than v1 and v2 back to the same level) do help, of course, but the most noticeable reductions in deaths and serious illness from a single change are from higher vaccine efficacy towards variant v3. The combined reduction is greater, but less than the sum of the individual changes.
Summary outcomes for all scenarios in Options A and B
I summarise the results for the Options A and B and their scenarios in the following tables. We shall see later that outcomes for all other Options (for a given set of variant v3 characteristics) lie between the outcomes for Option A (the lowest) and Option B (the highest) here.
First, the detail for each of the four variant v3 scenarios in each Option;
| Option | Scenario | Change type | v3 change fSS/fmort | v3 var_eff | Active cases peak | Serious cases peak | Cumulative Day 800 deaths | Deaths reduction to base | % Deaths reduction to base |
|---|---|---|---|---|---|---|---|---|---|
| B | UK482 | base | v1/2+30% | 70% | 3.5m | 130k | 192,348 | – | – |
| B | UK483 | -vir/mort | as v1/v2 | 70% | 3.5m | 100k | 178,330 | 14,018 | 7.29% |
| B | UK484 | +vacs | v1/2+30% | 100% | 2m | 65k | 166,104 | 26,244 | 13.64% |
| B | UK485 | both | as v1/v2 | 100% | 2m | 50k | 158,241 | 34,017 | 17.7% |
| A | UK486 | base | v1/2+30% | 70% | 1m | 40k | 154,588 | – | – |
| A | UK487 | -vir/mort | as v1/v2 | 70% | 1m | 30k | 149,014 | 5,574 | 3.6% |
| A | UK488 | +vacs | v1/2+30% | 100% | 600k | 15k | 140,903 | 13,685 | 8.85% |
| A | UK489 | both | as v1/v2 | 100% | 600k | 12k | 138,336 | 16,252 | 10.51% |
We see clearly that in both options A and B, the % reduction made by improving the vaccine efficacy coefficient var_eff for the variant v3, to the same as that of v1 and v2, is about double the % reduction resulting from removal of its 30% enhanced virulence and mortality compared with those earlier variants. Making both changes together, of course, has the greatest effect, although the result is less than the sum of the individual effects of the two changes.
In terms of the operational choices before us, however, regarding things we can change (the variants’ innate characteristics in real life are immutable, of course), the model deaths in the Option A model scenarios, with no June 21st lockdown easing, are on average (across all variant v3 assumptions) 16% better than their equivalent Option B scenarios resulting from the planned June 21st easing, as we see from the following table.
| Options | Base # | v3 vir/mort 30% lower | v3 100% of v1/v2 vaccine efficacy | with both v3 changes | Averages |
|---|---|---|---|---|---|
| B deaths | 192,348 | 178,330 | 166,104 | 158,241 | 173,756 |
| A deaths | 154,588 | 149,014 | 140,903 | 138,336 | 145,710 |
| % reduction | -22.75% | -16.44% | -15.17% | -12.58% | -16.14% |
The vaccine efficacy coefficient var_eff is susceptible to current research work and vaccine development to target specific “spikes” in new variants, but even at the pace research scientists and pharmaceutical companies have worked to bring us this far with vaccines, it’s a medium/longer term action compared with decisions about NPIs and other operational changes we could make in the summer months.
In some parts of the UK, including Delta variant hot-spots such as Bolton and Glasgow, accelerated vaccination has been started as a remedial measure, and this could take effect in weeks rather than months. Most hospital admissions have been of non-vaccinated people, or those who haven’t had their second dose yet, who might not have yet been scheduled, or others who have otherwise been hesitant.
The Government has embarked on vaccination “marketing” programmes, with some success, showing by example well-known and respected individuals getting their vaccinations, as well as highlighting the vastly greater danger from contracting Covid-19 compared with any vaccine risk such as blood clots, which are incredibly rare.
Surge testing and tracing has been used before to trace previous outbreaks, and this is also underway in areas of higher Delta variant incidence.
It is possible to ameliorate some effects of Covid-19 infection with drugs such as Dexamethosone, but for the purposes of this blog post, these would be too detailed (and marginal) for my scope.
Delay options
The next question to explore is what difference a delay of the June 21st planned NPI relaxation would make. A delay would allow more people to get their vaccinations, including second vaccinations, affording greater protection against the new variants, it is thought, on the basis of the very low percentage of those being hospitalised who have had their first, and even fewer of those who have had their second vaccinations. It would also allow more analytical time to assess which NPI changes are likely to be more effective and less costly in terms of health impacts.
Option B2: 14-day NPI relaxation delay to July 5th
The UK Government seems reluctant to modify its plans for the June 21st lockdown relaxation step, the PM having said a few days ago that they have seen nothing in the data to persuade them of that, but there has more recently been more consideration and discussion of a minimal 14-day delay of the opening up of the economy. I have run that as Option B2, without much confidence that such a short delay, to Day 521, July 5th, would make a material difference, and here are the results.
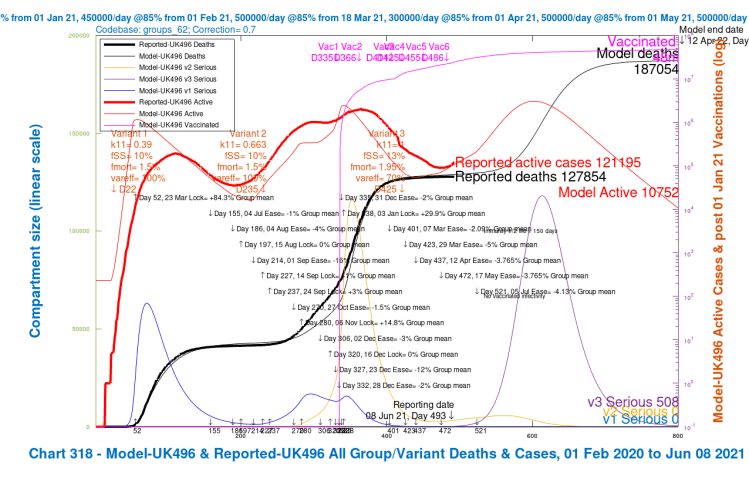
Chart 318 for scenario UK496 with vaccinations and 5th July 2021 final NPI relaxation. v3 transmission k11 = 1, var_eff = 70%, fss and fmort +30%. Model 800 day outcomes to April 12th 2022 compared with reported active cases and deaths to June 8th. Serious cases for 3 variants 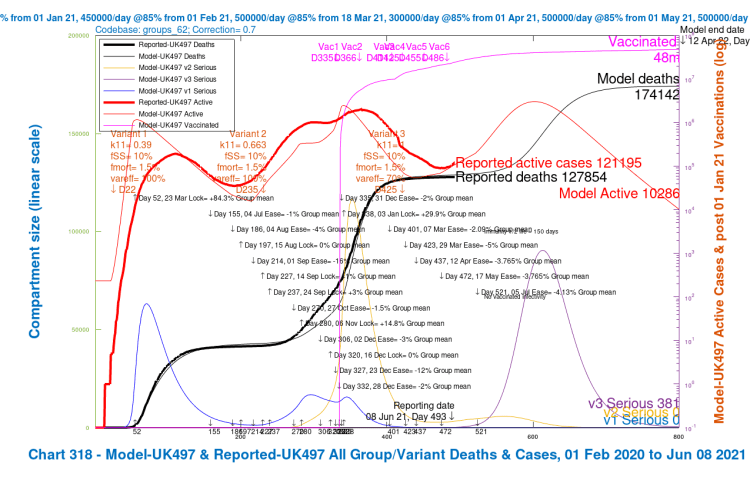
Chart 318 for scenario UK497 with vaccinations and July 5th 2021 final NPI relaxation. v3 transmission k11 = 1, var_eff = 70%, fss and fmort as v1 and v2. Model 800 day outcomes to April 12th 2022 compared with reported active cases and deaths to June 8th. Serious cases for 3 variants 
Chart 318 for scenario UK498 with vaccinations and July 5th 2021 final NPI relaxation. v3 transmission k11 = 1, var_eff = 100%, fss and fmort +30%. Model 800 day outcomes to April 12th 2022 compared with reported active cases and deaths to June 8th. Serious cases for 3 variants 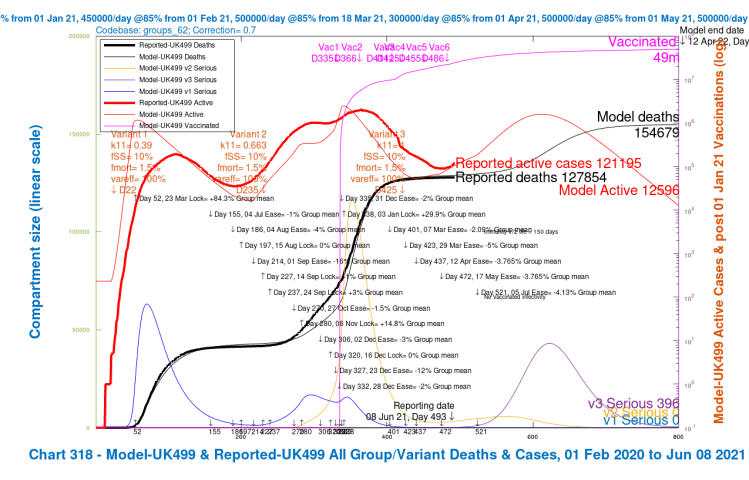
Chart 318 for scenario UK499 with vaccinations and July 5th final NPI relaxation. v3 transmission k11 = 1, var_eff = 100%, fss and fmort as fort v1 and v2. Model 800 day outcomes to April 12th 2022 compared with reported active cases and deaths to June 8th. Serious cases for 3 variants.
The charts do indicate some improvement, however, and further benefits of delay are two more weeks to assess options, and more vaccination time (the latter contributing to the improvement in this Option). I will show further Options and then summarise all of them.
Options C and D – 28 and 56-day delays of the June 21st relaxation
I have run similar scenarios, with the same range of variant v3 characteristics, for two more options with the full NPI relaxation plan, with more delay – Option C with a 28-day delay, and Option D with a 56-day delay. The extra delays have a more positive impact, as we see from the following charts, where, as before, we can also see the vaccination (magenta) curve still increasing through that part of 2021. This means that delayed NPI relaxations have the benefit of being made in the context of a higher proportion of (partly and fully) vaccinated people in the population.
Option C: 28-day delay to July 19th
The following 4-slide slideshow for Option C has the same variant scenarios as before, and parallels Options B and B2 above, but with a 28-day delay, with the last NPI relaxation on Day 535, July 19th 2021, instead of June 21st.

Chart 318 for scenario UK472 with vaccinations and 19th July 2021 final NPI relaxation. v3 transmission k11 = 1, var_eff = 70%, fss and fmort +30%. Modelled 800 day outcomes to April 12th 2022 compared with reported active cases and deaths to June 4th. Serious cases for three variants. 
Chart 318 for scenario UK473 with vaccinations and July 19th 2021 final NPI relaxation. v3 transmission k11 = 1, var_eff = 70%, fss and fmort as v1 and v2. Model 800 day outcomes to April 12th 2022 compared with reported active cases and deaths to June 4th. Serious cases for 3 variants 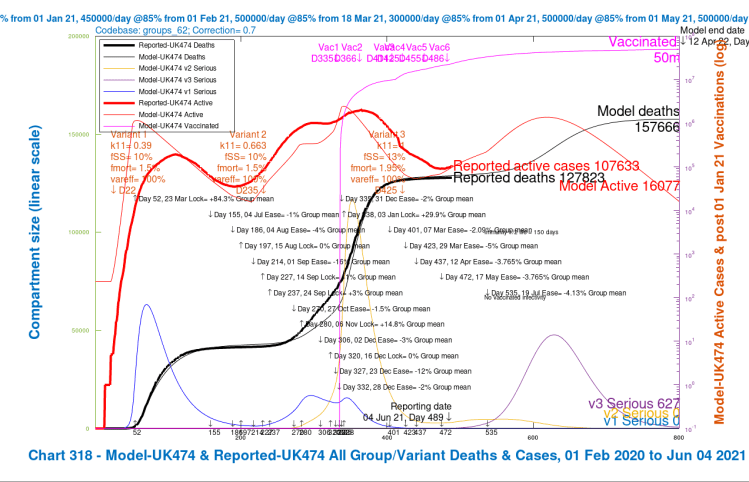
Chart 318 for scenario UK474 with vaccinations and July 19th 2021 final NPI relaxation. v3 transmission k11 = 1, var_eff = 100%, fss and fmort +30%. Modelled 800 day outcomes to April 12th 2022 compared with reported active cases and deaths to June 4th. Serious cases for three variants. 
Chart 318 for scenario UK475 with vaccinations and July 19th final NPI relaxation. v3 transmission k11 = 1, var_eff = 100%, fss and fmort as fort v1 and v2. Model 800 day outcomes to April 12th 2022 compared with reported active cases and deaths to June 4th. Serious cases for 3 variants
Option D: 56-day delay to August 16th
The 4-slide slideshow for Option D, which also has the same variant scenarios as before; Option D parallels Options B2 and C above, but with a longer 56-day delay of the last NPI relaxation, to Day 563, August 16th 2021.

Chart 318 for scenario UK476 with vaccinations and 16th August 2021 final NPI relaxation. v3 transmission k11 = 1, var_eff = 70%, fss and fmort +30%. Modelled 800 day outcomes to April 12th 2022 compared with reported active cases and deaths to June 4th. Serious cases for three variants. 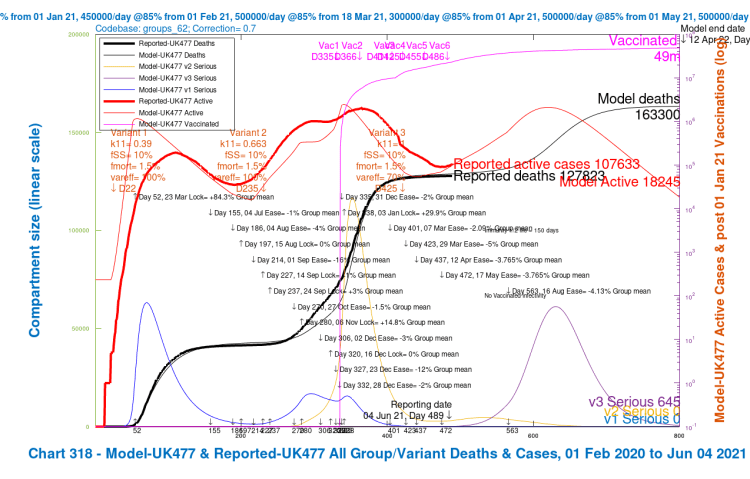
Chart 318 for scenario UK477 with vaccinations and August 16th 2021 final NPI relaxation. v3 transmission k11 = 1, var_eff = 70%, fss and fmort as v1 and v2. Model 800 day outcomes to April 12th 2022 compared with reported active cases and deaths to June 4th. Serious cases for 3 variants. 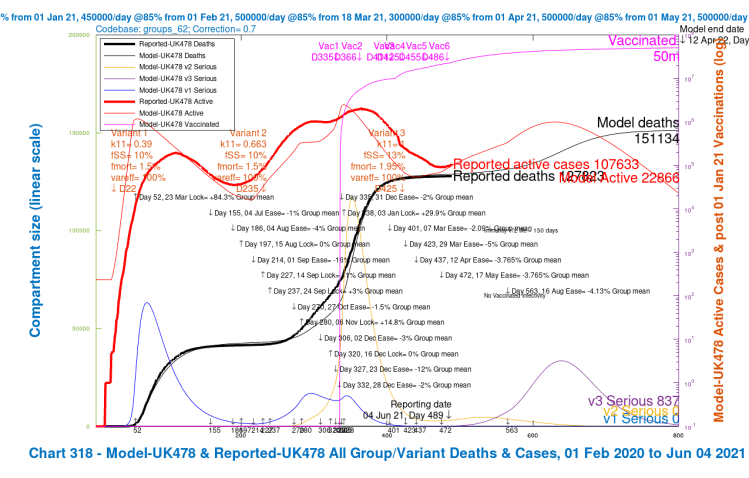
Chart 318 for scenario UK478 with vaccinations and August 16th 2021 final NPI relaxation. v3 transmission k11 = 1, var_eff = 100%, fss and fmort +30%. Modelled 800 day outcomes to April 12th 2022 compared with reported active cases and deaths to June 4th. Serious cases for three variants. 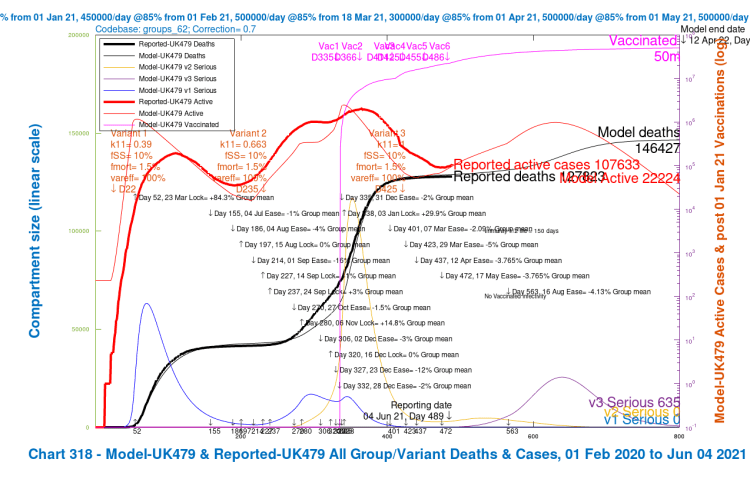
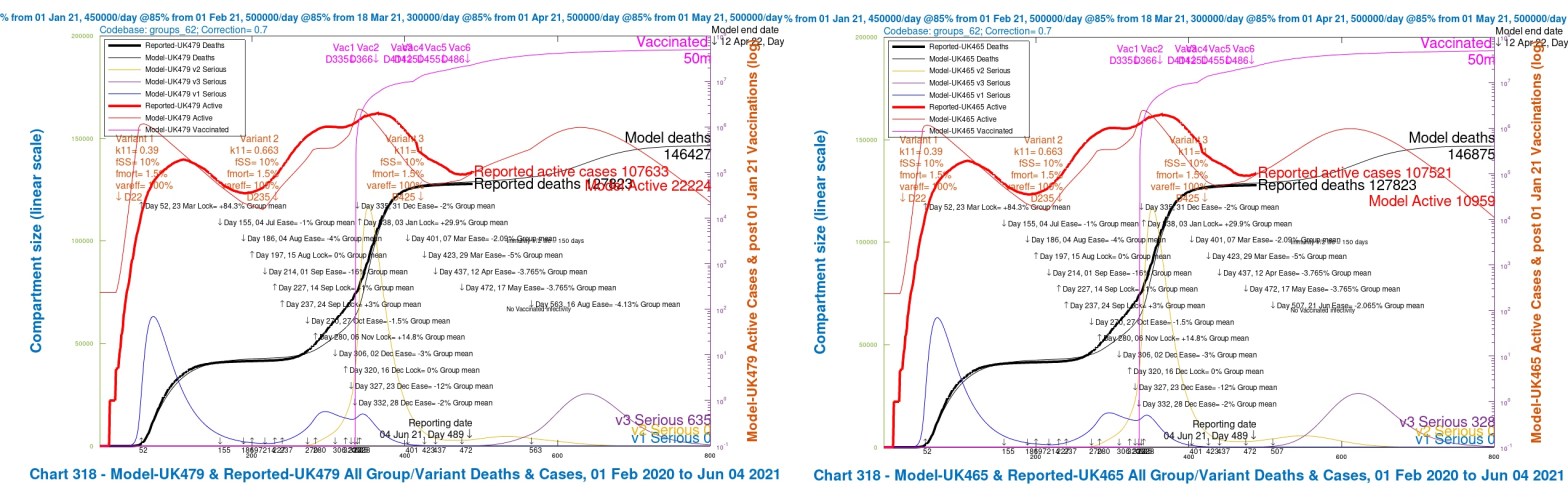
Chart 318 for scenario UK479 with vaccinations and August 16th final NPI relaxation. v3 transmission k11 = 1, var_eff = 100%, fss and fmort as fort v1 and v2. Model 800 day outcomes to April 12th 2022 compared with reported active cases and deaths to June 4th. Serious cases for 3 variants.
In both Options C and D we see large reductions in deaths and the peak in serious cases compared with Option B, when the last NPI relaxation was at the UK Government’s originally intended date, June 21st, and also compared with Option B2, with the shorter 14-day delay.
Option E: reducing the June 21st NPI easing
In my model, I assign a specific % effectiveness to every NPI (for each of the four population groups independently), and as a first exploration I will halve the overall relaxation in the NPI effectiveness on June 21st (day 507 in the model) from -4% to -2%, to emulate a 50% reduction in the NPI relaxation measures planned to be taken at that time.
Here is the equivalent slideshow for the four scenarios in Option E, UK462, UK463, UK464 and UK465, where the Day 507 June 21st NPI has a mean effectiveness decrease of ~2% instead of the previous ~4%, the weighted average of the NPIs across the four population groups in the model.

Chart 318 for scenario UK462 with vaccinations and June 21st 2021 2% NPI relaxation. v3 transmission k11 = 1, var_eff = 70%, fss and fmort +30%. Modelled 800 day outcomes to April 12th 2022 compared with reported active cases and deaths to June 3rd. Serious cases for 3 variants. 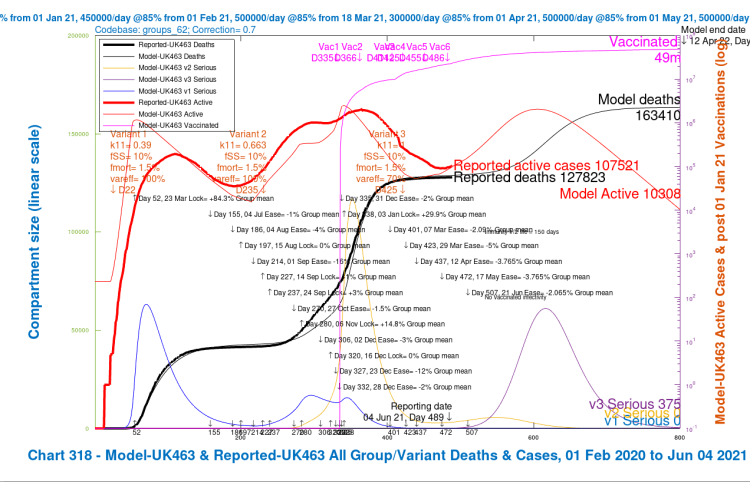
Chart 318 for scenario UK463 with vaccinations and June 21st 2021 2% NPI relaxation. v3 transmission k11 = 1, var_eff = 70%, fss and fmort as v1 and v2. Modelled 800 day outcomes to April 12th 2022 compared with reported active cases and deaths to June 3rd. Serious cases for 3 variants. 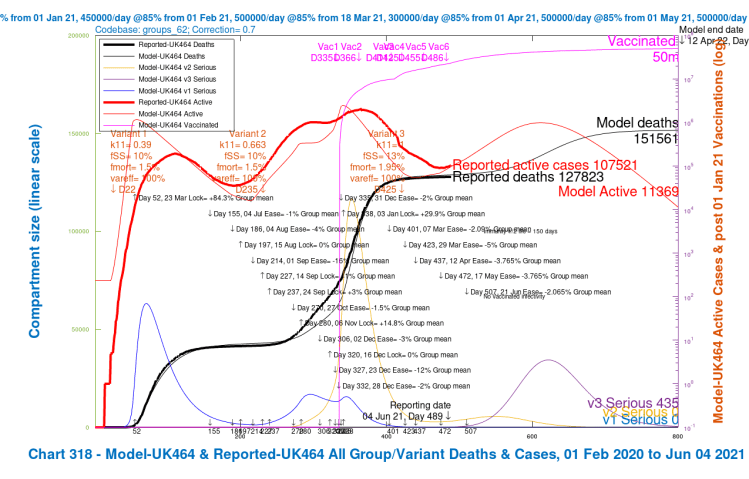
Chart 318 for scenario UK464 with vaccinations and June 21st 2021 2% NPI relaxation. v3 transmission k11 = 1, var_eff = 100%, fss and fmort +30%. Modelled 800 day outcomes to April 12th 2022 compared with reported active cases and deaths to June 3rd. Serious cases for 3 variants. 
Chart 318 for scenario UK465 with vaccinations and June 21st 2% NPI relaxation. v3 transmission k11 = 1, var_eff = 100%, fss and fmort as for v1 and v2. Model 800 day outcomes to April 12th 2022 compared with reported active cases and deaths to June 3rd. Serious cases for 3 variants
In this Option E, there is a good reduction in the peak of serious cases and in Day 800 deaths. The scenarios with higher vaccine efficacy for v3 again show the dominant benefit. We can see how all six Options so far compare in the following table.
| Option summary | Base # deaths | with v3 vir/mort 30% lower | v3 100% of v1/v2 vaccine efficacy | with both v3 changes | Average Day 800 deaths | Average reduction vs. Option B |
|---|---|---|---|---|---|---|
| B, base | 192,348 | 178,330 | 166,104 | 158,241 | 173,756 | – |
| A, no NPIs | 154,588 | 149,014 | 140,903 | 138,336 | 145,710 | -16.14% |
| B2, 14 delay | 187,054 | 174,142 | 161,642 | 154679 | 169,379 | -2.52% |
| C, 28 delay | 182,078 | 170,238 | 157,666 | 151,535 | 165,379 | -4.82% |
| D, 56 delay | 173,161 | 163,300 | 151,134 | 146,427 | 158,506 | -8.78% |
| E, 50% NPI | 173,171 | 163,410 | 151,561 | 146,875 | 158,754 | -8.64% |
We can see several things from the charts for Options B2, C, D & E, summarised in the table. Restoring vaccine efficacy against variant v3 again has more effect than the virulence and mortality reductions, although, of course, both together have most effect.
Although the 14-day NPI delay in Option B2 makes some difference, the longer NPI delays in Options C (28 days) and D (56 days) make a more significant reduction in active cases, serious cases and deaths outcomes (greater reductions than I would have thought), as well as allowing more time to understand the data from the previous NPI relaxations.
More predictably, the halving of the NPI relaxation in Option E from -4% to -2% on Day 507, June 21st, even with no delay, also has a large effect. It has, coincidentally, almost an identical effect to the 56-day delay of the full -4% relaxation in Option D.
The best scenarios with NPIs, in terms of lower Day-800 deaths (146,427) are the 56-day delayed -4% NPI Option D, UK479, as well as the June 21st -2% NPI Option E’s scenario UK465 (146,875). They are both near to the average (145,710) of the Option A scenarios that have no June 21st NPI at all.
Either the 56-day delay of the full 4% NPI relaxation on August 16th, or the reduced 2% NPI relaxation on June 21st, according to the model, would save many more lives (about 9% fewer than in Option B, the current Government plan) than other Options that include any NPIs (if nothing else were to change, or if no other actions were taken subsequently – which I think they would be). Option A, with no further NPI relaxation, remains the Option with the best outcomes, from a strictly health point of view.
Mixing delay and reduced NPI relaxation
A combination of a delay and the reduction in NPI relaxation would have a greater effect – for example, adding the shorter 14-day delay to the NPI relaxation reduction is a possibility – of which there are many.
My feeling is that the Government might prefer NPI adjustment and no delay, as long as there is no subsequent need for reversal of any measures, having already stated that the long intervals between NPI adjustments were there precisely to avoid the potential for reversals. In that case, they might feel it is more in keeping with their announced intentions to modify the extent of the lockdown easing on June 21st, rather than to change the date, although that might present a more complicated package of restrictions.
Option F – 50% of the NPI reductions, and 14-day delay to 5th July
As I write this, however, I read (probably press speculation attributed to leaks from “insiders” at Number 10) that a 14-day delay is being considered (as well as fewer NPI relaxations, perhaps). That might look like this – moving the June 21st date to July 5th, with the 50% version of the NPI relaxations – a mixed strategy, Option F.
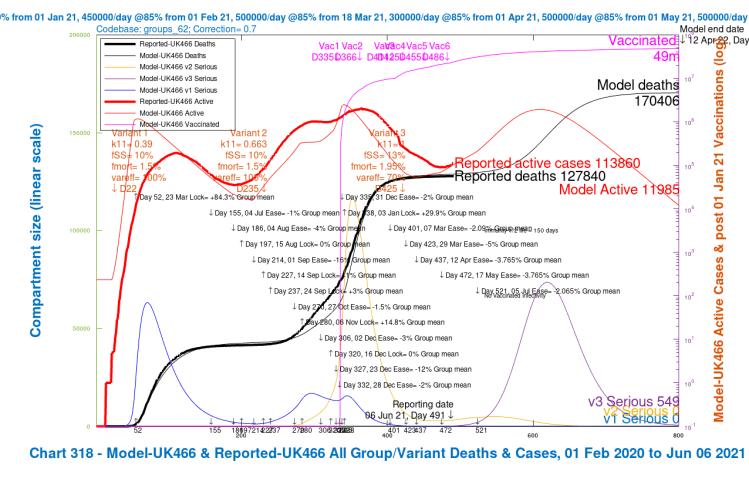
Chart 318 for scenario UK466. June 21st 2% NPI relaxation delayed 14 days. v3 transmission k11 = 1, var_eff = 70%, fss and fmort +30%. Modelled 800 day outcomes to April 12th 2022 compared with reported active cases and deaths to June 6th. Serious cases for three variants. 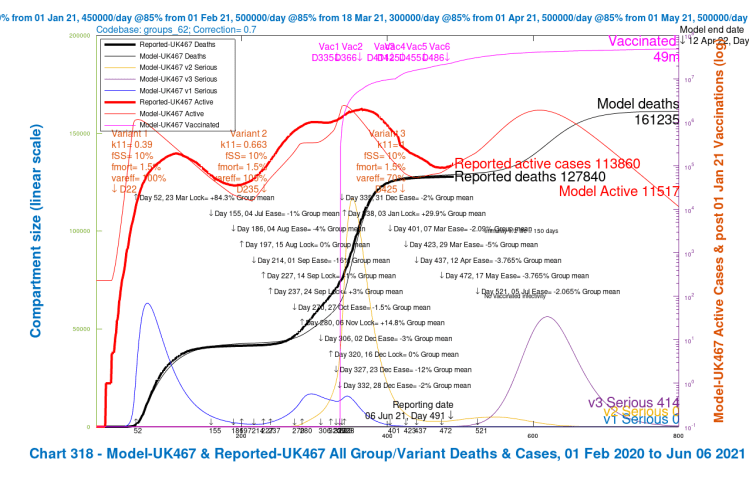
Chart 318 for scenario UK467. June 21st NPI 2% relaxation delayed 14 days. v3 transmission k11 = 1, var_eff = 70%, fss and fmort as v1 and v2. Modelled 800 day outcomes to April 12th 2022 compared with reported active cases and deaths to June 6th. Serious cases for three variants. 
Chart 318 for scenario UK468 June 21st 2% NPI relaxation delayed 14 days. v3 transmission k11 = 1, var_eff = 100%, fss and fmort +30%. Modelled 800 day outcomes to April 12th 2022 compared with reported active cases and deaths to June 6th. Serious cases for three variants. 
Chart 318 for scenario UK469. June 21st 2% NPI relaxation delayed 14 days. v3 transmission k11 = 1, var_eff = 100%, fss and fmort as for v1 and v2. Modelled 800 day outcomes to April 12th 2022 compared with reported active cases and deaths to June 6th. Serious cases for three variants.
With about 10% reduction in deaths on average, this mixed Option F is only slightly better than the best of the previous five Options with NPIs, either Option D (the full NPIs, with 56-day delay) or Option E (the 50% reduced NPIs on June 21st, with no delay), both at around 9% reduced deaths, but it might be operationally more flexible and politically more acceptable.
Option G & H – 50% of the NPI reductions on July 19th or August 16th
I quickly ran two more versions of this mixed strategy, with 28 and 56-day delays (Options G and H respectively), to compare with Option E with no delay, and with the 14-day delay Option F charted above, all with the 50% reduction in NPI relaxations. First, Option G with 2% NPI relaxation with 28-day delay to July 19th:
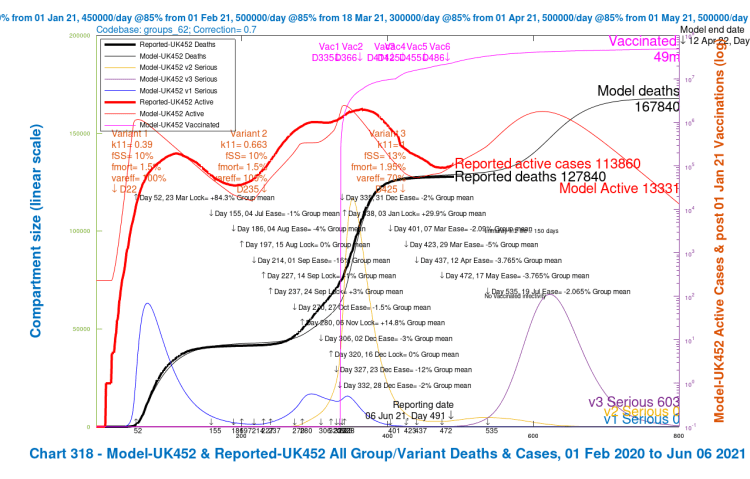
Chart 318 for scenario UK452 with vaccinations and 19th July 2% NPI relaxation. v3 transmission k11 = 1, var_eff = 70%, fss and fmort +30%. Model 800 day outcomes to April 12th 2022 compared with reported active cases and deaths to June 6th. Serious cases for 3 variants 
Chart 318 for scenario UK453 with vaccinations and July 19th 2% NPI relaxation. v3 transmission k11 = 1, var_eff = 70%, fss and fmort as v1 and v2. Model 800 day outcomes to April 12th 2022 compared with reported active cases and deaths to June 6th. Serious cases for 3 variants 
Chart 318 for scenario UK454 with vaccinations and July 19th 2% NPI relaxation. v3 transmission k11 = 1, var_eff = 100%, fss and fmort +30%. Model 800 day outcomes to April 12th 2022 compared with reported active cases and deaths to June 6th. Serious cases for 3 variants 
Chart 318 for scenario UK455 with vaccinations and July 19th 2% NPI relaxation. v3 transmission k11 = 1, var_eff = 100%, fss and fmort as fort v1 and v2. Model 800 day outcomes to April 12th 2022 compared with reported active cases and deaths to June 6th. Serious cases for 3 variants
and now, Option H, with 2% NPI relaxation with 56-day delay to August 16th, which shows greater improvements with the longer delay.

Chart 318 for scenario UK456 with vaccinations and August 16th 2% NPI relaxation. v3 transmission k11 = 1, var_eff = 70%, fss and fmort +30%. Model 800 day outcomes to April 12th 2022 compared with reported active cases and deaths to June 6th. Serious cases for 3 variants 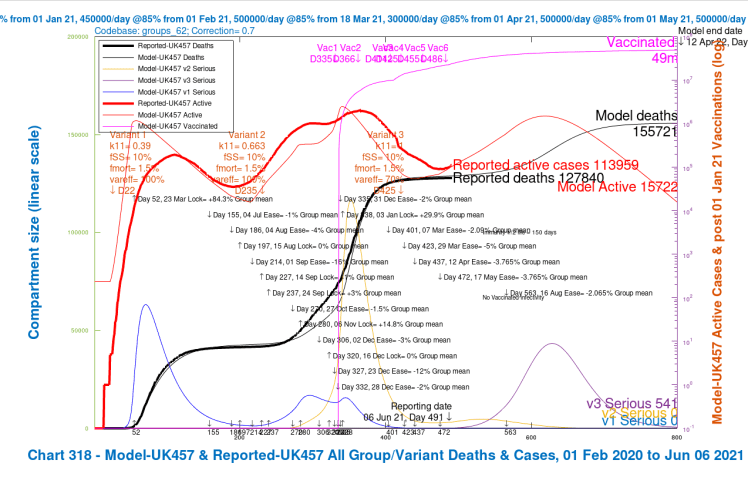
Chart 318 for scenario UK457 with vaccinations and August 16th 2% NPI relaxation. v3 transmission k11 = 1, var_eff = 70%, fss and fmort as v1 and v2. Model 800 day outcomes to April 12th 2022 compared with reported active cases and deaths to June 6th. Serious cases for 3 variants 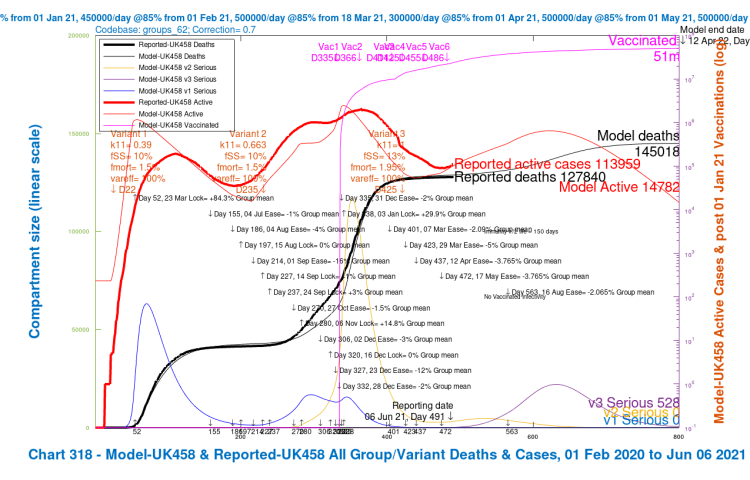
Chart 318 for scenario UK458 with vaccinations and August 16th 2% NPI relaxation. v3 transmission k11 = 1, var_eff = 100%, fss and fmort +30%. Model 800 day outcomes to April 12th 2022 compared with reported active cases and deaths to June 6th. Serious cases for 3 variants 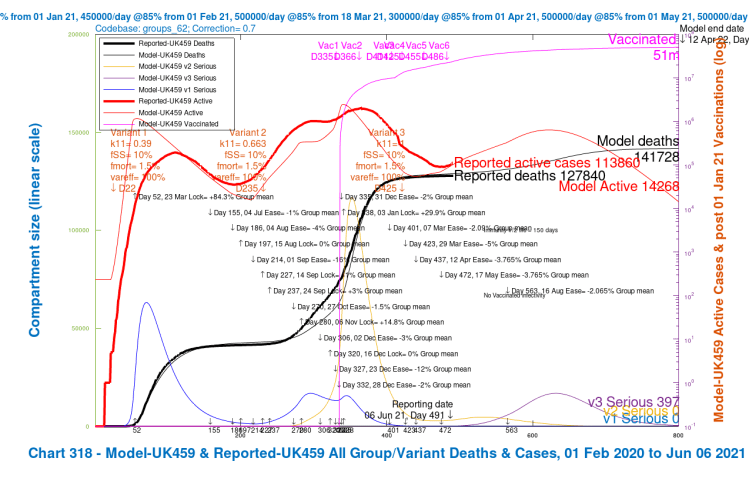
Chart 318 for scenario UK459 with vaccinations and August 16th 2% NPI relaxation. v3 transmission k11 = 1, var_eff = 100%, fss and fmort as fort v1 and v2. Model 800 day outcomes to April 12th 2022 compared with reported active cases and deaths to June 6th. Serious cases for 3 variants
Summary Outcomes of all Options
These further mixed options are all shown in the table below, with the previous Options, showing the reductions in deaths at Day 800 calculated against the original scenarios in Option B, which I have included in the top line again for comparison.
Option B, remember, has the -4% full NPI relaxation, applied on June 21st. Options B2, C and D, as before, have 14, 28 and 56-day delays respectively with the full NPI relaxation setting. Options F, G and H are the mixed options, with the reduced -2% lockdown relaxation, with 14, 28 and 56-day delays respectively.
At the bottom line is the previous Option A, with no June 21st NPI step at all.
| Option | June 21st % NPI | Delays | Base case deaths | With v3 vir/mort 30% lower | 100% of v1/v2 vaccine efficacy | With both v3 changes | Average | Average % saving against Option B |
|---|---|---|---|---|---|---|---|---|
| B | -4% | none | 192,348 | 178,330 | 166,104 | 158,241 | 173,756 | – |
| B2 | -4% | 14 day | 187,054 | 174,142 | 161,642 | 154679 | 169,379 | -2.52% |
| C | -4% | 28 day | 182,078 | 170,238 | 157,666 | 151,535 | 165,379 | -4.82% |
| D | -4% | 56 day | 173,161 | 163,300 | 151,134 | 146,427 | 158,506 | -8.78% |
| E | -2% | none | 173,171 | 163,410 | 151,561 | 146,875 | 158,754 | -8.64% |
| F | -2% | 14 day | 170,406 | 161,235 | 149,573 | 145,297 | 156,628 | -9.86% |
| G | -2% | 28 day | 167,840 | 159,229 | 147,830 | 143,923 | 154,706 | -10.96% |
| H | -2% | 56 day | 163,322 | 155,721 | 145,018 | 141,728 | 151,447 | -12.84% |
| A | none | – | 154,588 | 149,014 | 140,903 | 138,336 | 145,710 | -16.14% |
Unsurprisingly, for a given NPI % relaxation, the longer the delay, the better the outcomes. At nearly 13%, the 56-day (8-week) delay, Option H, with 50% reduction of the originally planned NPI relaxation isn’t too far from Option A, with its 16% saving from cancellation of the last NPI relaxation step altogether. Option A, however, is a scenario very unlikely to be chosen by Government, but is presented here for comparison and calibration.
I would guess that if none of the full 4% NPI relaxation Options are regarded as sufficiently safe, there is some version of the four 2% NPI relaxation Options E, F, G and H that the Government might find more acceptable, with the option of further actions later if the short-term consequences prove disappointing.
What others think
Models are, and mine is no exception, a useful indicator of outcomes that aren’t necessarily intuitive, and I can understand, if experts such as Adam Kucharski and Neil Ferguson are seeing outcomes like mine in their own model projections, why they would think that a short delay might be useful.
Adam Kucharski
The BBC reported thus: ‘…Dr Adam Kucharski, a member of the Scientific Pandemic Influenza Group on Modelling (SPI-M) that advises the government, said there were a “number of concerning signs” following the earlier finding that vaccine first doses aren’t as effective against the Delta variant and that people infected with the variant could be more likely to need hospital care.
He told BBC Radio 4’s Today programme that the “increase in transmission” could potentially cause “considerable problems” and that it was “hard to be confident” that it would not lead to a “big number” of hospital admissions.
Asked for his view about the June lifting of restrictions, Dr Kucharski said the new variant had “changed” the equation.
“We are not facing the virus that we were facing two months ago. If we were facing the B.117 (Kent) variant as the dominant one, the fact it (the vaccines) is working very well, case numbers are coming down nicely, we could have some more confidence that there could be reopening without seeing those surges.
“But we’re not… if say in two weeks we’re in a situation where hospitalisations have been rising, where local health systems are coming under pressure, I think it will be quite difficult to justify adding more transmission to that kind of situation.”‘
Neil Ferguson
The Independent newspaper reported Prof Neil Ferguson thus: ‘It comes as Imperial College expert Professor Neil Ferguson, one of the architects of the first lockdown, warned that overall UK data on the spread of the virus was heading in a “negative direction.”
He said the Delta variant, which was first identified in India, could be “between about 30 and maybe even up to 100 per cent more transmissible” than previous iterations of the virus.
“We haven’t yet been able to pin down how it translate translates into hospitalisations,” he told the BBC.
“We’re seeing an hospitalisations in the north west, and a couple of other areas, but it’s too early to say, and that’s critical because we do expect vaccines to give a high level of protection still, but exactly how high its critical what size third wave we might see.”’
The Independent SAGE group
This same article also reported that the Independent SAGE group (a group of scientists led by Sir David King, a previous UK Chief Scientific Adviser), second-guessing the official SAGE Government advisory body, were also recommending delay, which is reported in detail in the Financial Times thus: ‘Professor Christina Pagel, a mathematician at University College London, told the group’s weekly briefing: “We now have an exponentially increasing dominant variant that is more transmissible, more vaccine resistant and likely more severe than Alpha.”’
Their chair, Sir David King, is reported to have said that there is evidence of a third wave and that the June 21st NPIs should be delayed by a few weeks.
An NHS provider view – Chris Hopson
Fundamental to understanding how the Delta variant will affect us is what impact the vaccines are having in breaking the links between transmission (infectivity)/virulence of the virus, and the illness, serious illness, hospitalisations and mortality caused in those who are infected by it.
As Chief Executive of NHSProviders, a membership organisation for NHS hospital, mental health, community and ambulance services, Chris Hopson is well placed to understand the impact on the NHS of these links.
He is reported as becoming more confident of these links having been broken by vaccines (although he isn’t so confident he has been reported accurately). Others, such as some I have mentioned before, are not yet so confident, at least until they know more about the Delta variant.
He wrote a 25 point Twitter thread which I think is an interesting analysis of some of the issues facing us with the Delta variant, and is worth reading. His views are also presented at a June 9th blog on the NHSPoviders site.
Care with modelling
In one of those thread tweets (#24/25), however, he says “For the record, trust leaders are sceptical of value of predictive statistical models here given their performance over last 15 months. Leaders point to the crude assumptions that have to be made and the huge shifts in outcome if small changes are made to those assumptions.”
I would agree about the non-linearity of outcomes with inputs, which is why it’s important to run sensitivities, as I have done in this post, and in my others. It is generally the case in science that real physical processes are not linear, and the mathematical equations describing the physics, chemistry or biology of a process are often linearised by scientists as a first step in order to be able to solve them, moving towards more accurate non-linear models when the underlying processes are better understood.
Such non-linearity would hardly be surprising in a viral epidemic, characterised at times by exponential growth. Small changes early on – for example a few days delay in imposing NPIs at the outset – can have large effects later on, as we have seen.
Both developing those mathematical models, and writing computer codes to simulate such processes, help the scientific thinking process itself. Such mathematical and computer models should be used, interpreted and quoted with care, especially by those who didn’t create them, and/or don’t have the time to absorb them fully.
Imperial College March 16th 2020 Report 9
I mention, in this context, a paper I have referenced before, the well-known Imperial College “Report 9” of March 16th 2020, that was pivotal in persuading Government of the need for lockdown (which it took 9 crucial days for them to execute; see my May 14th 2020 blog post on the effect of that delay). Report 9 has often, seemingly, been misquoted, misunderstood or not read properly, with only the direst projections referenced.
Those worst case projections were relevant only if few of the NPI options analysed in the report were enacted, and I cover that in some detail in my September 22nd 2020 blog post, when I also said “The UK Government has just announced some reversals of the current lockdown easing, and so before I model the additional interventions announced today, I want to illustrate quickly the behaviour of the model in response to changing the effectiveness of current interventions, reflecting the easings that have already been made, and also to highlight the sensitivity of the forecasts of case and death rates to the influence of lockdown effectiveness.” [italicised for emphasis here]
In that post, I highlighted this table from the Imperial College Report 9 which summarises the effectiveness of the many NPIs available, triggered by levels of ICU bed requirements in their adaptive model at the time, and calibrated by ICU peak bed requirements, and total (cumulative) deaths.

The many scenarios and outcomes in Report 9, and their related projections, were finely nuanced against many potential types of NPIs, as can be seen from the usefully colour-coded table and its description.
Model types
Not all epidemiological models are of the statistical type (for example Monte-Carlo simulation) that Chris Hopson mentioned. Some are bottom-up mechanistic (as mine is) using differential equations to describe the underlying viral behaviour in the prevailing population, variant mix, infection, NPI and vaccination context.
Some use simplistic 3 or 4 parameter General Logistics functions for top-down curve-fitting of a classical generic epidemic disease “S-curve” behaviour to published data only, for a quick broad-brush view and projection, possibly prior to a more detailed model, taking no account of the (changing) underlying viral and NPI contexts (called a phenomenological approach). Such models have sometimes led to very poor longer term (and even short term) forecasts when the viral and NPI environments change.
Imperial College’s MRC Centre for infectious diseases analysis, as do other academic departments such as Warwick University and the London School of Hygiene and Tropical Medicine (LSHTP), use several modelling techniques for different purposes – for either detailed or overview models, for the shorter or longer term, or for other purposes, as this table from the Imperial Covid-19 planning tools website indicates.

I have covered the key differences in several previous blog posts, including my July 14th 2020 one, and several more around that time. I found Gerard Chowell’s 2016 paper on Mathematical model types very useful to help my understanding.
Discussion
It isn’t likely that the June 21st lockdown easing will be cancelled (Option A), but as we have seen, there are many suggestions of a few weeks delay from some leading scientists advising Government (as I have mentioned above and previously) and from some others whom I mentioned in my most recent post, to give more time to be more sure of the impact, as well as for more vaccination. My modelling figures, if repeated elsewhere, illustrate the quandary for Government.
Other options are to adjust the NPI measures planned to be taken on June 21st, perhaps by retaining face-masks in certain situations, and/or retaining recommendations on working from home, or mixing the approaches of a short delay and reducing the extent of the NPI relaxation.
Progress must be made at some point in restoring the UK economy, allowing people to travel, to work and to socialise, and to bring mainstream physical and mental health NHS services back to centre stage. But if official projections show these kinds of impacts (if that is indeed what advisers to Government are also seeing in their epidemiological models), other actions need to be found to arrest the increase in cases.
Delay much beyond 56 days might need a different analysis, since by then (mid-August) we would be getting closer to the autumn, with a changed climatic environment potentially more suitable for coronaviruses such as SARS-Cov-2.
Infections and hospitalisations
We see the start of that increase in active cases – infections – evidenced by the solid red curves (the reported data) in my charts beginning to tip upwards. As I said above, the upwards impact on serious cases, and then on potential deaths would normally follow within a couple of weeks, depend on what the virulence and mortality of the Delta variant really is, and how much the links between cases, hospitalisations (and potentially ICU admissions and deaths) have been reduced for that variant by the vaccines.
In this context I’ll mention Twitter threads by several commentators; one by Dr Duncan Robertson, who charts some detailed tracking of recent data on cases, hospitalisation and ICU occupancy in an extended thread; another by John Murdoch-Burn of the Financial Times, a frequent and informed commentator on the pandemic, who presents charts showing recent patient data from the North-West of England; and this Sky News article, which is a good analysis of the issues facing Government.
All sources indicate growing hospitalisations, although mortality will probably be lower, as the younger cohort of cases (because a much larger proportion of older and vulnerable people have been vaccinated) will be more resilient against the infections.
Looking at model outcomes by population group
I mentioned earlier that my model is organised into four population groups, differentiated by age/vulnerability, introduced in my earlier posts, most recently in my June 1st post, where I show how the population groups differ in terms of susceptibility to the different variants, particularly variant v3. I use the same population groups for this post. You’ll see that the average virulence fSS and mortality fmort scenarios (the bottom line in the table) are as summarised in the settings table earlier in this post, but the model always uses the population group settings, even if results are presented UK-wide (as in the Charts 318 above).
| Group | Description | % of UK population | v1 fSS | v1 fmort | v2 fSS | v2 fmort | v3 fSS | v3 fmort |
|---|---|---|---|---|---|---|---|---|
| 1 | Active/younger | 33.5% | 5% | .16% | 5% | .16% | 6.5% | .2% |
| 2 | Caregivers/mid-age | 30% | 12.6% | 1.17% | 12.6% | 1.17% | 16.4% | 1.52% |
| 3 | At risk | 17.5% | 25.2% | 6.26% | 25.2% | 6.26% | 32.8% | 8.14% |
| 4 | School-going | 19% | .63% | .004% | .63% | .004% | .82% | .0051% |
| All | Weighted average by % pop | 100% | 10% | 1.5% | 10% | 1.5% | 13% | 1.95% |
The vaccination schedule also differs for the four groups, again the same for this post as for previous ones. Note that children are not vaccinated in the model, as per the regulatory situation so far in the UK.
| Model Day | Date from: | Groups included | Vaccinations per day | Efficacy vac_eff | v1 var_eff | v2 var_eff | v3 var_eff |
|---|---|---|---|---|---|---|---|
| 335 | January 1st | Group 3 – At risk only | 300,000 | 70% | 100% | 100% | 70% or 100% |
| 366 | February 1st | Group 3 – At risk only | 450,000 | 85% | 100% | 100% | 70% or 100% |
| 411 | March 18th | Groups 2 and 3 | 500,000 | 85% | 100% | 100% | 70% or 100% |
| 425 | April 1st | Groups 2 and 3 | 300,000 (first doses) | 85% | 100% | 100% | 70% or 100% |
| 455 | May 1st | Groups 2 and 3 | 500,000 | 85% | 100% | 100% | 70% or 100% |
| 486 | June 1st | Groups 1, 2 and 3 | 500,000 | 85% | 100% | 100% | 70% or 100% |
I will show just one group of charts (Charts 21–24) to illustrate the different outcomes for the four population groups for just one of the scenarios in one of the Options above, one that might be nearer to any version chosen by the Government.
Let us use one of the mixed Options, Option G, with 2% reduced NPIs on July 19th, the 28-day delay version. There are four v3 variant scenarios for each Option, so I will use the worst-case one, UK452, for this Option G, that has the most dangerous variant v3 settings, to show the variability in outcomes for the four population groups. Similar charts could be shown for any of the scenarios, for any Options, but some relative characteristics of the charts are common as between population groups.
The average saving of lives vs. the base case in Option G was was 11%, but for the UK452 scenario with the most dangerous parameters for variant v3, the saving was 12.74%.
But my main purpose here is to show the relative cases, serious illness and mortality by population group in the model. The slideshow below enables visual comparison of those relative outcomes. Note, for example, how the vaccination schedule (the light blue curve in these charts) is different for each group, and is absent for Group 4, school-age children.
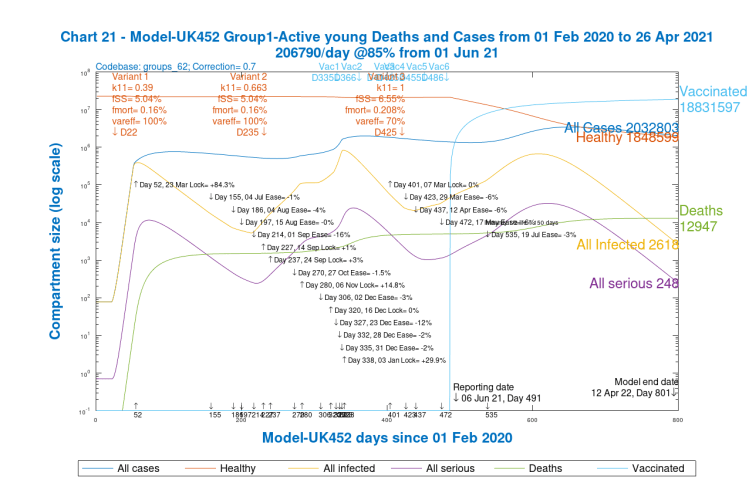
Chart 21 for scenario UK452 with vaccinations and 19th July 2% NPI relaxation. v3 transmission k11 = 1, var_eff = 70%, fss and fmort +30%. Model 800 day outcomes to April 12th 2022 for Group 1, Active Young. Case types and deaths 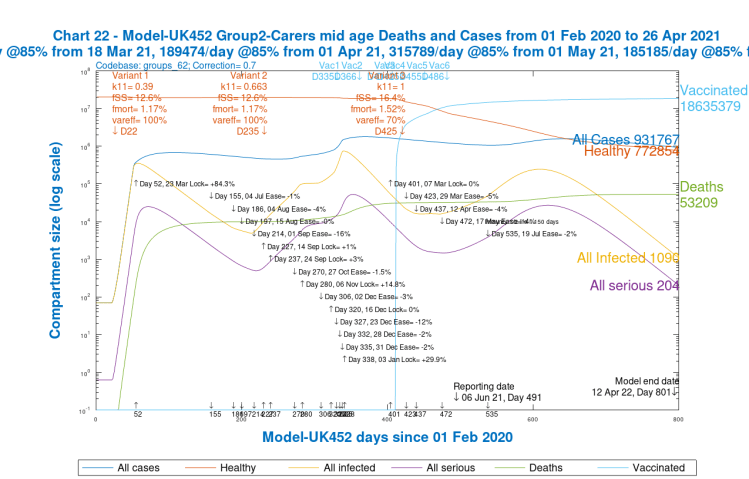
Chart 22 for scenario UK452 with vaccinations and 19th July 2% NPI relaxation. v3 transmission k11 = 1, var_eff = 70%, fss and fmort +30%. Model 800 day outcomes to April 12th 2022 for Group 2, Carers / mid-age. Case types and deaths 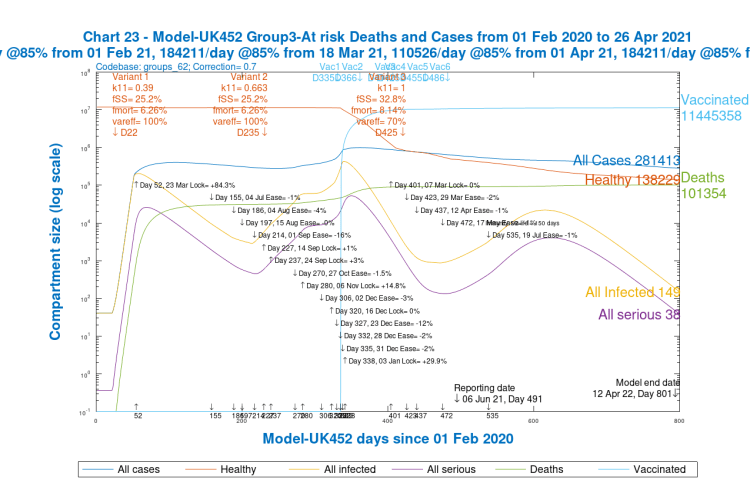
Chart 23 for scenario UK452 with vaccinations and 19th July 2% NPI relaxation. v3 transmission k11 = 1, var_eff = 70%, fss and fmort +30%. Model 800 day outcomes to April 12th 2022 for Group 3, At risk / older. Case types and deaths 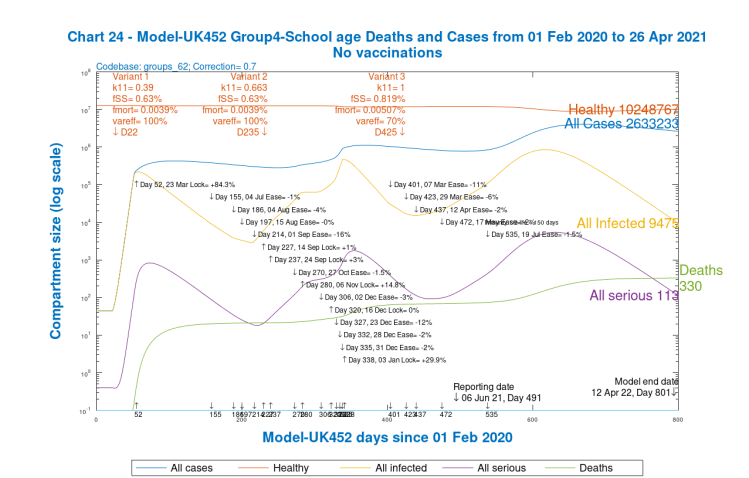
Chart 24 for scenario UK452 with vaccinations and 19th July 2% NPI relaxation. v3 transmission k11 = 1, var_eff = 70%, fss and fmort +30%. Model 800 day outcomes to April 12th 2022 for Group 4, School-age. Case types and deaths
We see that case numbers for Active/Younger (working and socialising) people and School-age children are very high (~2.5m), as are infections; they are quite high for mid-age people (~1m), and much lower (~300k) for older people. On the other hand, cumulative deaths are highest for the older / at risk group, and then mid-age, followed by younger people, and tiny for children, as we might expect.
Remember, however, that cumulative deaths include the whole period of the pandemic; after the first quarter of 2021, we see much less growth in deaths in older / at risk people, who have been the priority for vaccination, as shown in the vaccination schedule table above, but more discernible 2021 growth in deaths for Groups 1 and 2, Active/Younger and Mid-age.
The charts show that in 2021, serious cases peak (essentially caused by variant v3 as we saw in all the earlier charts) at ~30k for younger and also mid-age people, but a tenth of that for at-risk / older people, and children.
Model settings for variant virulence and mortality for the different groups need to be chosen carefully to get these differences right, but we can already see that vaccination makes a big difference (the charts show vaccination starting later for the young groups, and not yet for children).
Office for National Statistics on case numbers
As I write this, it is reported that cases in the last week have risen 75% compared with last week, mostly, it is thought, owing to the Delta variant, and we can see that the lighter red curve in my charts (the modelled active cases) gives some justification for expecting the increase in reported cases to continue, most noticeably in Option B, on the UK Government’s current June 21st NPI relaxation assumptions, but also in other Options.
In their Coronavirus (COVID-19) Infection Survey, UK, for 4 June 2021, the ONS (Office for National Statistics) have indicated that increase in new cases, stating that although genetic sequencing isn’t complete for infections, “in the week ending 29 May 2021, we have seen an increase in cases in England that are not compatible with the UK variant B.1.1.7 (labelled “Alpha”* by the World Health organisation (WHO)); these are likely to be the variant B.1.617.2 (WHO “Delta”), first identified in India.“
When they say “not compatible“, they mean that a specific genetic marker of the Alpha variant is not seen in the early analyses of the majority of the new cases, and the conclusion is that most are from the Delta variant (91% was announced on 10th June and also here).
[*The “Alpha” variant (previously called the “Kent” variant) corresponds to variant v2 in my model; the “Delta” variant is v3. Incidentally, in the new WHO (World Health Organisation) terminology, the South African variant is “Beta” and the Brazil variant is “Gamma”.]
Concluding comments
In the unlikely event that June 21st NPI relaxations were removed altogether, my model indicates a reduction of between 12% (with variant v3 assumptions at their least dangerous) and 23% (for the most dangerous v3) in cumulative deaths by model Day 800 (April 12th 2022), averaging 16% compared with the full relaxation in NPIs planned for June 21st, depending on assumptions about variant v3‘s virulence, mortality and resistance to vaccines.
Delays of the full relaxation package by 14, 28 or 56 days also show reductions in deaths, averaging about 2.5%, 5% and 9% respectively across all variant v3 assumptions, compared with the 16% average reduction for (the unlikely) removal of that NPI relaxation step.
A reduction of 50% in the planned NPI relaxations on June 21st, to 2%, without any delay, would also average about a 9% reduction in deaths by Day 800 compared with the full NPI relaxation step. A mixed approach of partial NPI relaxation and delay of 14, 28 or 56 days sees average reductions in deaths of 10%, 11% or 13%, respectively.
I suspect the UK Government might prefer to maintain the date of the 21st June, and to reduce the scale of the relaxations from the originally intended removal of all legal restrictions, unless this over-complicates the new “rules”. But they may be forced to a different approach, depending on how cases and hospitalisations develop over the next 10 days.
The absolute figures in the approaches I have modelled are pessimistic, since further actions – other NPIs, surge testing & follow up, and more targeted vaccination for example – would surely be taken if the current daily increases in the reported active cases were to translate into higher rates of hospitalisations, ICU admissions and deaths.
I have much more confidence that the comparisons – the direction of the numerical differences – between the modelled outcomes of the scenarios are more credible, and indicate some feasible options for decision-makers, who have to keep the population safe while preserving the economy as far as possible.

One thought on “Coronavirus Delta variant impact on June 21st easing – delay or reduce?”