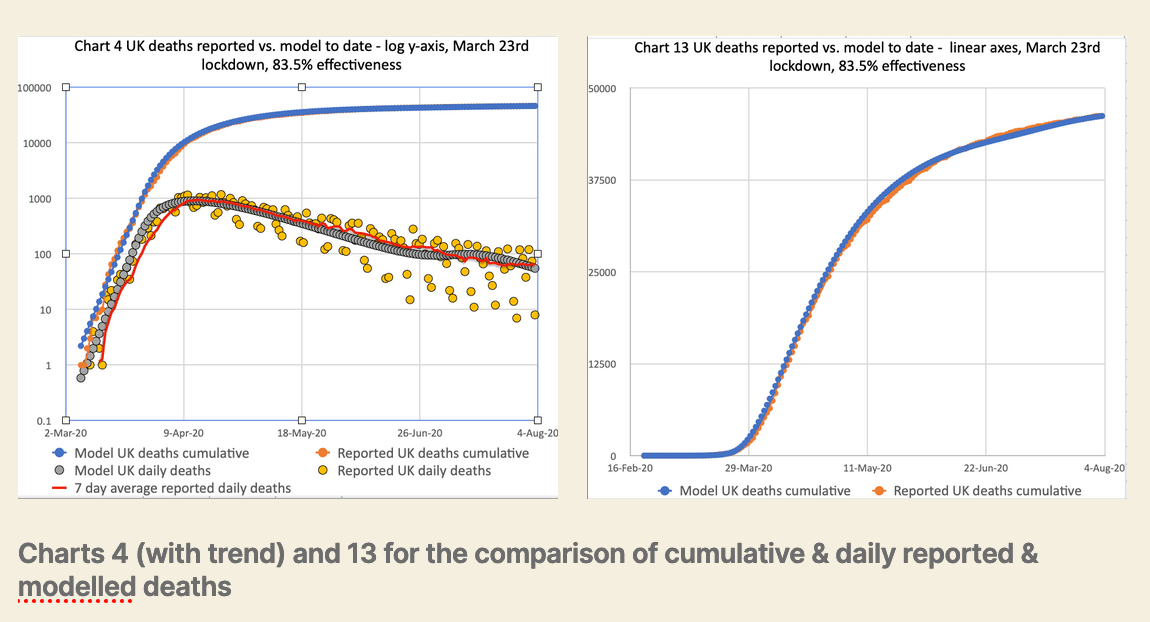
As I reported in my previous post on 31st July, the model I use, originally authored by Prof. Alex de Visscher at Concordia University on Montreal, and described here, was to be updated to handle several phases of lockdown easing, and I’m glad to say that is now done. Alex has been kind enough already to adopt a method I had been considering, of introducing an array of dates and intervention effectiveness parameters, and I have been able to add the recent UK Government relaxation dates, and the estimated effectiveness of each into a new model code. I have run two sets of easing parameters as a sensitivity test.
Author Archives: docbrs
The effect of lockdown easing in the UK – Coronavirus
As reported in my previous post, there has been a gradual reduction in the rate of decline of cases and deaths in the UK relative to my model forecasts. This decline had already been noted, as I reported before, by The Office for National Statistics and their research partners, the University of Oxford, and reported on the ONS website.
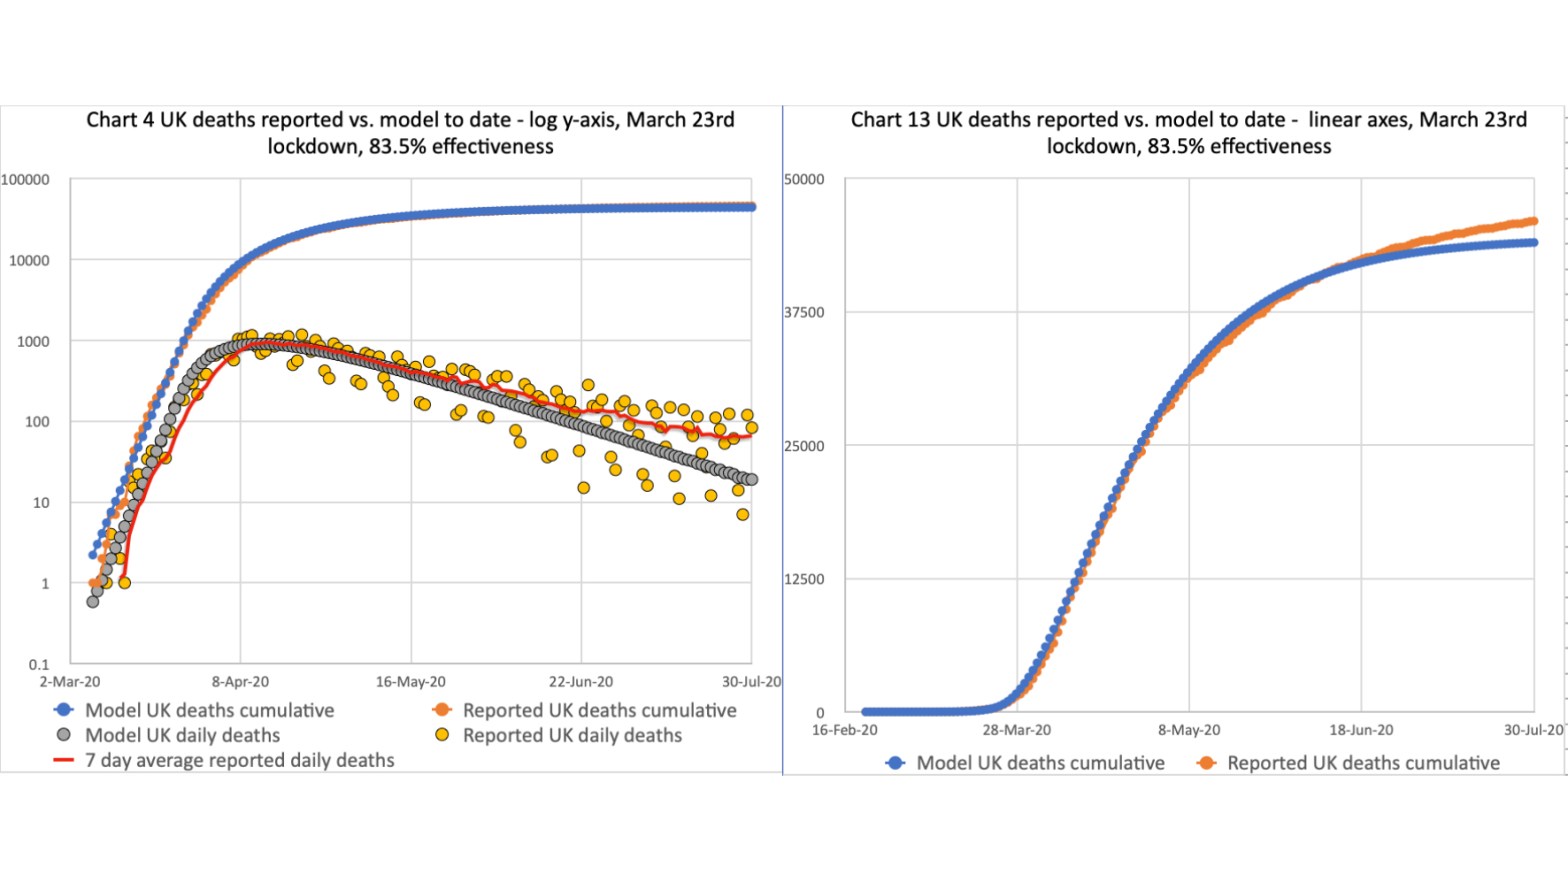
I had adjusted the original lockdown effectiveness in my model (from 23rd March) to reflect this emerging change, but as the model had been predicting correct behaviour up until mid to late May, I will present here the original model forecasts compared to the current reported deaths trend.
Introduce Yourself (Example Post)
This is an example post, originally published as part of Blogging University. Enroll in one of our ten programs, and start your blog right. You’re going to publish a post today. Don’t worry about how your blog looks. Don’t worry if you haven’t given it a name yet, or you’re feeling overwhelmed. Just click theContinue reading “Introduce Yourself (Example Post)”
Mechanistic and curve-fitting UK modelling comparison – Coronavirus

I thought it would be useful, at least for my understanding, to apply a curve-fitting approach to some of the UK reported data, and also to my model forecast based on that data.
Phenomenology & Coronavirus – modelling and curve-fitting

There is a range of modelling methods, successively requiring more detailed data, from phenomenological (statistical and curve-fitting) methods, to those which seek increasingly to represent the mechanisms (hence “mechanistic” modelling) by which the virus might spread.
We see the difference between curve-fitting and the successively more complex models that build a model from assumed underlying interactions, and causations of infection spread, between parts of the population.
Coronavirus modelling update
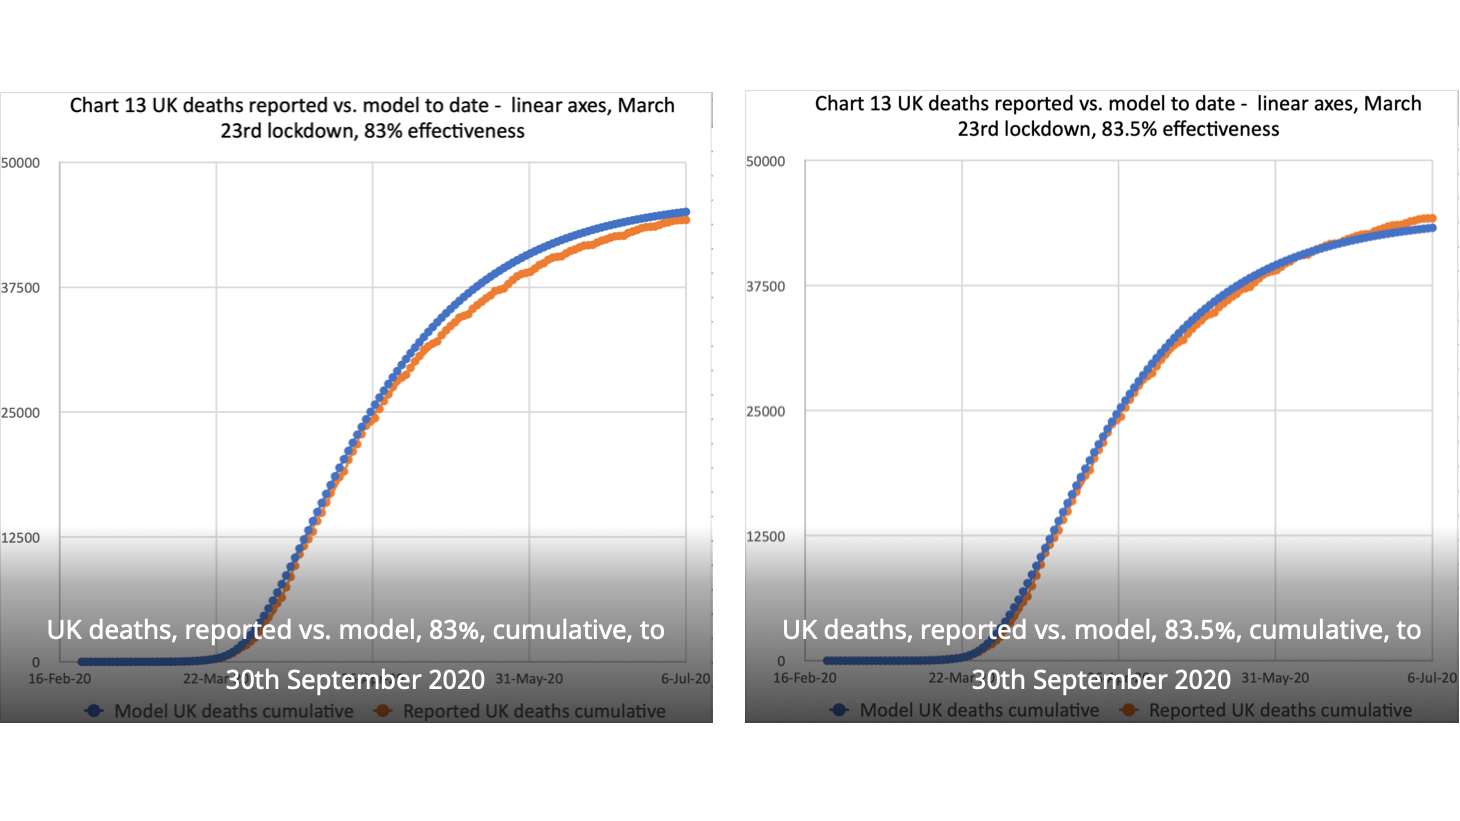
I have now reforecast my model with a slightly lower intervention effectiveness (83% instead of 83.5%), and, while still slightly below reported numbers, it is nearly on track
Some thoughts on the current UK Coronavirus position
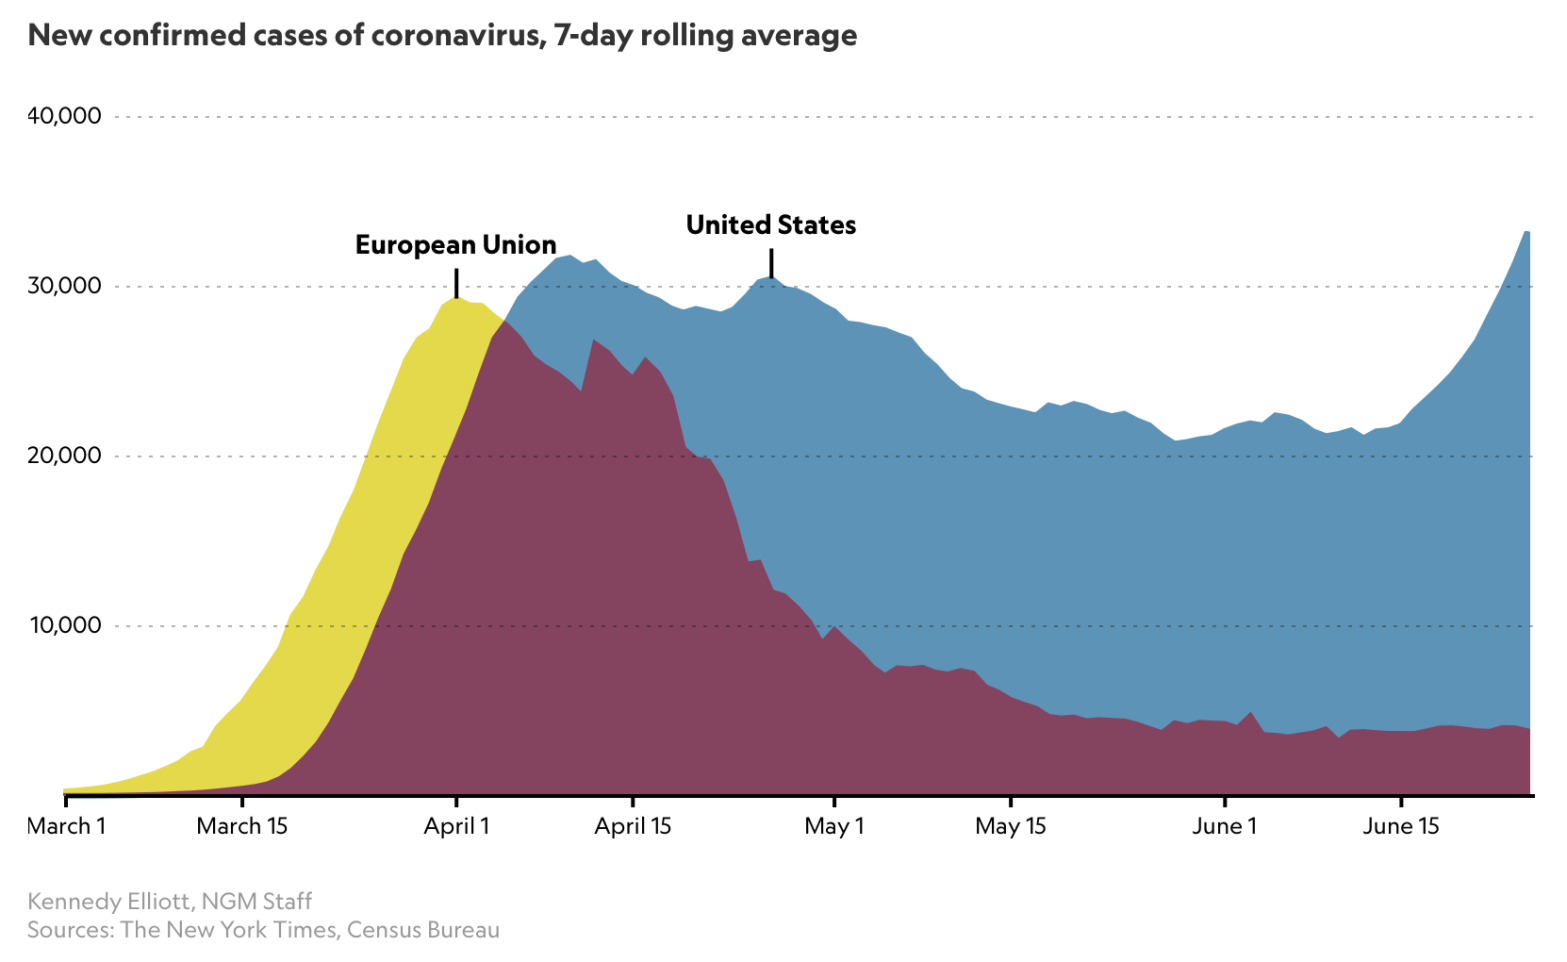
A couple of interesting articles on the Coronavirus pandemic came to my attention this week; a recent on in National Geographic on June 26, highlighting a starting comparison of the USA’s cases history and recent spike in case numbers with European data.
This article referred to an older National Geographic piece, from March, by Cathleen O’Grady, referencing a specific chart from Katy Armstrong of the Imperial College Covid-19 Response team.
I noticed, and was interested in that reference following a recent interaction I had with that team, regarding their influential March 16th paper.
Meanwhile, my own forecasting model is still tracking published data quite well, although over the last couple of weeks I don’t think the published rate of deaths is falling as quickly as before.
The Surrey Hills in the 2019 Prudential RideLondon 100

This video is about the Surrey Hills part of my Prudential RideLondon 100 in 2019, taking in Leith Hill and Box Hill. It’s a “director’s cut” from my full ride post at https://www.briansutton.uk/?p=1084. The middle part of the video shows the cycling log-jam on Leith Hill, where we had to stop seven times, losing 10Continue reading “The Surrey Hills in the 2019 Prudential RideLondon 100”
