
Summary
My December 10th blog post explored the possible outcomes for the Omicron outbreak on the basis of limited data available at that time.
The situation still isn’t clear, but I have run updates to my model for lower and medium vaccine jab efficacies to Omicron, and lower, medium and higher virulence and mortality, as well as a scenario with lower transmission rate, and continue to compare with reported data.
Introduction
While evidence is still in short supply, nothing has firmly contradicted the impression that Omicron is highly transmissive, as well as being possibly less virulent. The UK Government’s latest technical briefing 32 shows what is currently known about variants. Expert reactions to this information are shown at the Science Media Centre website here.
The UK Health Security Agency (UKHSA) also publish daily review updates, including this one on Omicron as I write this (19th December).
There are some complicating issues with interpreting the South African data for Omicron to help assess the impact on the UK: a) the different demographics (much lower average age than the UK) in South Africa, and b) the high level of Delta infections they have already had there, both of which might tend to mitigate the impact of Omicron infection, suggesting Omicron might be more mild than is likely in the UK population. Hence I have run different options in my model to allow for higher as well as lower virulence.
There is some good academic research work on both Omicron virulence and vaccine escape, however, which I have referred below, which I have used to support the parameters I have used in my model.
One new idea about concurrent infections has been mooted since my last post, which I will discuss briefly first.
Concurrent infections?
If vaccines are less effective against Omicron than for Delta, we might arrive at a situation where two mutations – Delta and Omicron – are in play at the same time.
It was already clear that Alpha had “outcompeted” the original variant in finding people to infect in the UK, and that Delta out-competed Alpha, as, therefore, somewhat expected, and explained in the literature I referenced last time, showing that variants with higher R0 will displace variants with lower R0.
But in the Prime Ministerial national TV briefing last week, the UK Chief Medical Officer, Prof Chris Whitty, in the absence of much clear data so far about Omicron, stated that we might be experiencing one epidemic on top of another. It seems that Delta might not be dying away as quickly as we might have expected, as previous variants have.
In the press this weekend, Dr Trevor Bedford of the Fred Hutchinson Research Institute in Seattle was reported in The Times in an interesting article as saying “Omicron and Delta may be able to co-exist, having distinct ecological niches”.
I can see that if Omicron is able to escape vaccines to some extent, it might infect people who have had a vaccination that protects against Delta, and, as the Heineken advertisement says, can therefore reach places that Delta can’t (much).
But conversely, I don’t see how Delta reaches places that Omicron can’t, given that there are no special measures (that Delta might defeat) against Omicron yet. I should have thought, in that case, that the variant competition principle previously described would cause Delta to recede, as Omicron increasingly infects previously Delta-infected (or vaccinated) people, as well as being more transmissive to the usual susceptible people.
As a non-medic, I further wonder, therefore, a) are the Delta and Omicron variants different enough that they can infect a person simultaneously, or b) is it the case that a Delta-infected person isn’t susceptible (while still infected) to Omicron, and vice-versa? If a person already infected with one variant can remain susceptible to (some) other variants, even before recovering I have some additional coding to do!
My model does, however, handle differential efficacy of vaccines (for any of 1, 2 and 3 jabs) to different variants, as well as multiple and simultaneous variants (but not double infections), and I will present current outcomes on that basis.
Some recent Omicron research
Omicron was detected early on in South Africa, Hong Kong and was rapidly seen elsewhere, including the UK. It is still early to be definitive about its characteristics, but there are pointers in the research which has been substantial in recent weeks. The first I mention is from South Africa, and usefully indicates how rapid the growth of Omicron was.
University of Witwatersrand and others led by Nicole Wolter
This study was published on 21st December 2021, with many contributors across health bodies and Universities in South Africa, the communicating author being Dr Nicole Wolter of the Centre for Respiratory Diseases and Meningitis at the National Institute for Communicable Diseases, of the National Health Laboratory Service.
As is usual, the paper is not yet peer reviewed, in the interest of making as much relevant data about the pandemic available as soon as possible.
Dr Wolter is also at the School of Pathology, Faculty of Health Sciences, University of the Witwatersrand, Johannesburg. Many co-authors represent other Universities and health organisations in South Africa, such as the University of KwaZulu Natal and the University of Cape Town.
Summary
The SARS-CoV-2 Omicron variant of concern (VOC) almost completely replaced other variants in South Africa during November 2021, and was associated with a rapid increase in COVID-19 cases.
The study aimed to assess clinical severity of individuals infected with Omicron, using S Gene Target Failure (SGTF), where a particular gene (one of the usual three) is missing in testing of Omicron patients compared with those infected by earlier variants. I show two key figures from the study report here.
The S Gene Target Failure method of detection shows that this is a new feature of Omicron compared with previous variants. S-gene absence usefully makes it easier to detect, as full genome sequencing isn’t required to identify it.


It is apparent that Omicron has grown very quickly compared with the prior variant, Delta, and that after Gauteng, most provinces in South Africa have experienced a steep rate of increase of Omicron once it has arrived.
Gupta Lab findings – Omicron virulence and vaccine escape
Professor Ravindra “Ravi” Kumar Gupta is a professor of clinical microbiology at the Cambridge Institute of Therapeutic Immunology and Infectious Disease at the University of Cambridge, and his Gupta Lab recently published their findings on Twitter.
They looked at not only the potential of Omicron to evade vaccines, but also at the relative ability of Delta and Omicron to infect lung tissue. First, about infectivity, they say “Omicron Spike protein mediates deficient cell entry and is inefficiently cleaved compared to Delta spike. We tested viral entry mediated by Wild Type, Delta and Omicron spikes using a pseudotyped virus system, infecting primary 3D lung alveolar organoids.“

Then, they say, “Omicron Spike protein induces relatively poor cell-cell fusion compared to WT and Delta. We expressed spike in cells stably expressing split GFP, so that Green signal could be measured over time upon cell-cell fusion and syncitia formation. The difference is significant.“
What does this all mean? They said “Efficient infection of lung cells could correlate with severity of lung disease. Syncitia or fused cells are often seen in respiratory tissues taken following severe disease. Delta was very good at both, in contrast to Omicron. Further work is needed.”
Finally they looked at vaccine efficacy, saying “We also tested how well antibodies from vaccinated individuals neutralised Omicron v Delta. We found that Omicron was poorly neutralised after two doses of mRNA or Ad vectored vaccine compared to Delta, but that the third dose (mRNA vaccine) [my emphasis] rescued this at an early time point.”

They summarised the findings by saying “In summary this work suggests that Omicron does appear to have become more immune evasive, but that properties associated with disease progression *may* be attenuated to some extent. The significant growth of Omicron nevertheless represents a major public health challenge.“
Professor Gupta, also a member of the UK Government’s advisory body, the New and Emerging Respiratory Virus Threats Advisory Group (NERVTAG), was reported as saying that experts were learning about the virus “all the time”. He warned that the increase in deaths and cases of Omicron was a “serious concern”.
Confirmed cases of the Omicron strain have risen by more than 12,000 in the UK – with London’s cases alone topping 10,000 – according to the latest data on Sunday 19th December.
Prof Gupta told Sky News: “The sheer numbers that are going to be affected because of the increased transmissibility of this virus is going to potentially overwhelm our health service. So that’s a really critical situation that we’re facing.”
The situation appears to be that even if Omicron causes less severe infection, sheer numbers infected, because of Omicron’s high transmission rate, means that even a lower proportion who are Seriously Sick, of a very much higher number of infected people, is still a large number.
University of Hong Kong
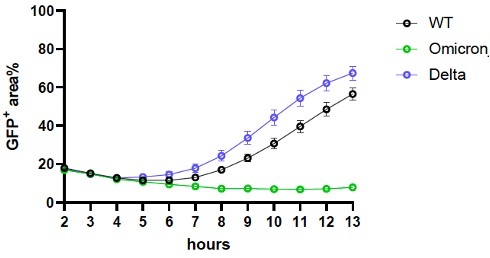
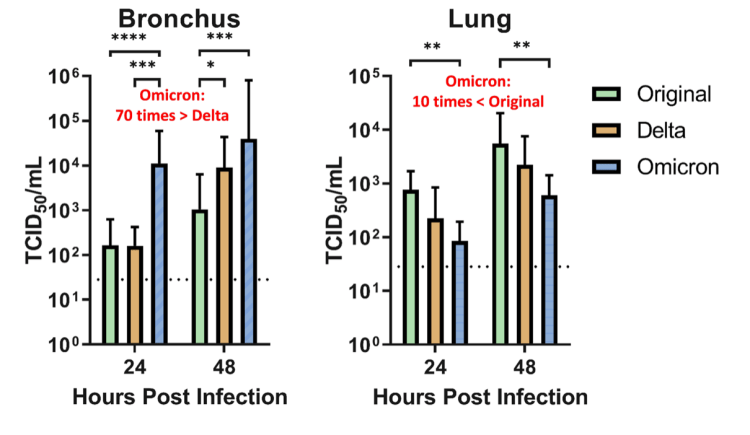
A study led Dr. Michael Chan Chi-wai and researchers from the LKS Faculty of Medicine at The University of Hong Kong (HKUMed) provides information on how the novel Variant of Concern (VOC) of SARS-CoV-2, the Omicron SARS-CoV-2 infect human respiratory tract. The researchers found that Omicron SARS-CoV-2 infects and multiplies 70 times faster than the Delta variant and original SARS-CoV-2 in human bronchus, which may explain why Omicron may transmit faster between humans than previous variants.
Their study also showed that the Omicron infection in the lung is significantly lower than the original SARS-CoV-2, which may be an indicator of lower disease severity. This research is currently under peer review for publication.
The following chart illustrates this, which seems to be consistent with the Gupta lab work above.
Alex Sigal work on vaccine efficacy to Omicron
This recent paper by Alex Sigal et al that I referenced last time indicated the propensity for Omicron to escape vaccines. It is also reported by CNBC, with commentary by Pfizer who say “Pfizer and BioNTech published initial lab results early Wednesday [8th December 2021] that also showed a significant reduction in the two-dose vaccine’s ability to fight omicron. However, the companies found that a booster dose offers significant protection against the variant and the two-dose series may still protect against severe disease.”
An updated version of this paper on December 15th, with more participants and experiments, has been submitted to medRxiv, and is available for download at the Sigal Lab website while it undergoes the medRxiv checks, as stated at Alex Sigal’s Twitter feed, where this chart appears, indicating the vaccine efficacy reduction to Omicron depending on prior vaccination or previous infection (or severe infection) and vaccination.

I would add more on vaccine escape, but searching for “Omicron vaccine escape research medrxiv” on Google produces a plethora of pre-publications. The Sigal paper above seems pretty mainstream in that context, I believe, and represents the research well.
Modelling
This all encouraged me with what I had already built into my model, including triple the transmissibility for Omicron compared with Delta.
For clarity I will present just a couple of single charts, to illustrate the model outcomes, and then tabulate other results in a table to show the range of outcomes depending on input parameters for virulence, mortality and relative vaccine efficacy (for 1, 2 and 3 jabs) vs efficacy to the earliest variants. I had made some reduction for Delta vs. the original and Alpha, but increased the vaccine escape potential for Omicron.
Afterwards I will also look at the impact of somewhat reduced transmissibility for Omicron, although still substantially above (double) the rate for Delta, and also for transmission rates in between those.
When might Omicron peak?
The peaks for Omicron for active cases, serious cases and deaths would be expected to be at slightly different times owing to incubation times for more serious illness to develop. In my model chart 318 we will see the peaks in active cases and serious cases from all variants, and chart 303 also shows when one variant overtakes another in those respects.
I have run six separate set of parameters for Omicron, as I did before, and I will highlight those case peaks in a table derived from the charts I have plotted.
Suffice to say that the range of virulence and relative vaccine efficacy parameters I have included do make a difference to outcomes, but not quite so much as I had thought they might. And not so much difference as a change in transmissibility makes, as we shall see.
Chart 318 showing overall comparisons with reported data
As usual, this chart 318 for Scenario UK_000 shows a good match for the model outcomes to date against reported deaths, and a fair match to the changing rates for active cases, to date, and goes on to show the projection out to late 2023. Clearly a lot can change by then, but we can see from the chart that things have already mostly levelled off by spring/summer 2022.

The modelled peak of about 8m in all Active cases (the thin red curve) occurs at about April/May 2022, dominated by variant v4 Omicron, at around the same time as the obvious peak in v4 Omicron serious cases (the light blue curve) at 65,000, just as each of the previous variants have caused corresponding (but somewhat lower) peaks in modelled active cases.
By December 2023, cumulative vaccinations are split between 3rd (booster) vaccinations at 49 million (which represent three times as many vaccinations, 147 million, as all booster vaccination recipients have also had first and second vaccinations), “both vacs” at 4m (representing 8 million aggregate 1st and 2nd vacs) and negligible first vaccinations (since nearly all recipients have had second and/or third vaccinations by then).
In The UK’s population of 67.8m, children under 12 are still not vaccinated, although it is reported that around 300,000 vulnerable children aged 5-11 are scheduled to be offered vaccines soon) and there are differing proportions of vaccine hesitation (also built into the model for four age/vulnerability groups). This is why the model doesn’t completely vaccinate the UK.
The UK Government’s advisory body, the Joint Committee on Vaccination and Immunisation (JCVI), have decided not to move further than with vulnerable children under 12 yet, based on data about the balance of risk/benefits to younger children in general, as they say in their latest report.
Altogether vaccinations in the model by the end of the simulation stand at 155 million (for the UK population of 67.8m). The last vaccination phase in my model is the December 2021 booster phase; there will no doubt be further ones in 2022 and beyond, probably twice a year if what we have seen of vaccination waning continues.
There are likely to be further Non-Pharmaceutical Interventions (NPIs) too, and once those, and further vaccination are taken into account, the projections for active and serious cases (sickness) and, to a lesser extent, deaths are likely to be fewer than the projections here.
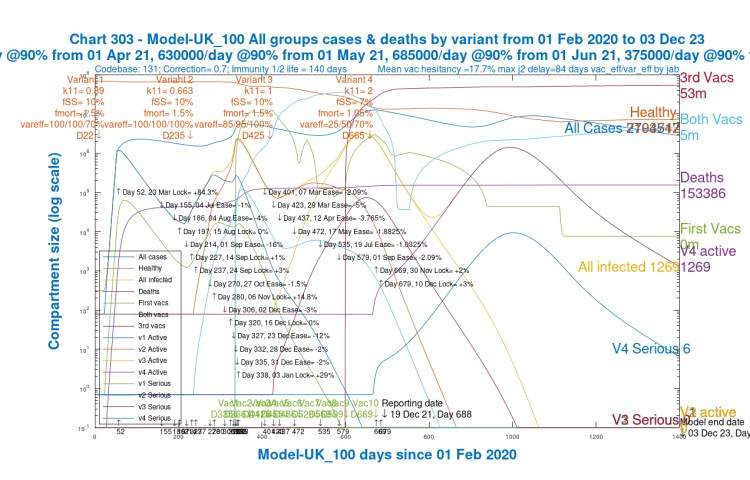
Chart 303 showing differential variant behaviour
Chart 303 is quite complicated, but in summary it shows: active and serious cases by variant (8 curves); all cases, healthy (never infected), all infected and deaths (4 curves); and the three vaccination volumes for first jabs, first plus second jabs, and all three jabs (3 curves altogether), 15 plots in all. As correspondents have indicated, it looks a little like the London Tube map. Hopefully the legend allows each curve to be identified.

We see again, in more detail, that the cumulative Omicron (v4) active cases overtake the Delta (v3) ones by early April 2022, and the Omicron v4 serious cases overtake those for Delta by May 2022, a little later owing to the increased time for serious cases to develop.
A noticeable difference for the v4 infections profile, at the high transmission rate of Omicron at three times that of Delta, is that the active and serious cases don’t decline as quickly as the previous variants did. I do have immunity waning built into the model, but I also suspect that the high transmission rate for Omicron I have included in this model scenario (3 times Delta’s) allows v4 Omicron to survive longer, at least until another more infective variant might come along to supersede it, and/or more efficaceous vaccines (to Omicron) take effect.
Omicron (v4) with lower transmission rate
To investigate the impact of the transmission rate for Omicron, I began by running an additional scenario UK_100, with my model’s v4 transmission at only double Delta’s transmission, rather than at three times Delta’s rate. The model’s k11 rate is therefore set to k11=2 in scenario UK_100 rather than k11=3, as it had been above in the previous six scenarios.
Chart 318 shows that model UK_100‘s v4 variant (representing Omicron) has a much reduced peak in active cases (the light blue curve as before), and is also very delayed, from Spring to the end of 2022.

The equivalent chart 303 for the new Scenario UK_100 shows the difference in the growth and decline of v4 even more clearly.
The peak in active cases (nearly all of which are Omicron cases) reduces from 8.5 million to a little over 1 million. The v4 Serious curve peaks at 5,000 rather than 65,000 before, and both peaks are much later, towards the end of 2022, than for the equivalent Scenario UK_000 with k11=3, where the active and serious cases peak in the spring of 2022.
If it were thought that the low v4 settings (compared with v3, Delta) for virulence (mortality is less likely to affect the growth rate) in this scenario have some effect, I confirm that these settings are the same in UK_000, so it is unlikely. Transmission rate k11 is the only change, reduced from 3 to 2.
On the basis of the short term model outputs compared with what we see in real life at the moment, therefore, I think that the transmission for Omicron must be well above double that of Delta’s, even though it might be below k11=3. It will probably take a little longer before we have enough evidence to set Omicron’s transmission in the model more accurately, but I will try an intermediate setting, k11=2.5, after summarising results so far in the next section.
Summary table with 7 scenarios
For the original k11=3 transmission setting, I ran six scenarios altogether, with two options at higher and lower vaccination efficacies for three jabs, for each of three cases for virulence/mortality – high, medium and low – to explore the differences we might see depending on how Omicron characteristics turn out, once we have more reliable data.
We see that increments in fSS/fMORT do increase the peaks in active and serious cases. Cumulative deaths are also increased, but to a lesser extent.
For each of the three settings for virulence and mortality, the two settings for relative vaccine efficacy var_eff to v4 Omicron – 25%/50%/70% and 50%/70%/85% (for 1,2 and 3 jabs respectively) – also make a difference to the peaks in active and serious cases, but to a lesser extent, and their effect on deaths is also proportionately much lower.
| Option | k11 | NPIs Nov30th /Dec10th | v4 fSS/ fmort | v4 var_eff | v4 Peak serious | All Peak active | 3/12/23 active | 3/12/23 deaths |
|---|---|---|---|---|---|---|---|---|
| UK001 | 3 | +2/+3% | 7/1.05% | 50/70/85% | 55k | 6m | 271,528 | 159,563 |
| UK000 | 3 | +2/+3% | 7/1.05% | 25/50/70% | 65k | 8.5m | 383,056 | 160,599 |
| UK004 | 3 | +2/+3% | 10/1.5% | 50/70/85% | 80k | 6.5m | 272,877 | 163,063 |
| UK002 | 3 | +2/+3% | 10/1.5% | 25/50/70% | 95k | 8.5m | 384,928 | 164,575 |
| UK005 | 3 | +2/+3% | 13/1.85% | 50/70/85% | 105k | 6.5m | 274,218 | 166,598 |
| UK003 | 3 | +2/+3% | 13/1.85% | 25/50/70% | 120k | 9m | 386,791 | 168,609 |
| UK100 | 2 | +2/+3% | 7/1.05% | 25/50/70% | 5k | 1m | 1,269 | 153,386 |
The seventh Scenario, UK_100, with lower Omicron transmission at k11=2, shows at least a couple of orders of magnitude fewer active and serious cases, although the reduction in long term deaths is much less pronounced.
We can also see from chart 318 that the currently increasing reported growth we see in Omicron cases in the UK isn’t compatible with k11=2, even if k11=3 is an over-estimate. Some more real-life evidence of the progress of Omicron in the UK will help to understand its transmission rate, virulence and mortality, to help with setting the model parameters, allowing longer term outcomes to be assessed.
Comparative outcomes for a transmission rate range
I briefly ran some further options to test outcomes against Omicron transmission rates between the values k11=2 and k11=3, and I show these in the table below. I won’t show all the charts, but one comparison is more interesting, and I will show that.
| Option | k11 | NPIs Nov30th /Dec10th | v4 fSS/ fmort | v4 var_eff | All Peak active | v4 Peak serious | 3/12/23 active | 3/12/23 deaths |
|---|---|---|---|---|---|---|---|---|
| UK100 | 2 | +2%/+3% | 7/1.05% | 50/70/85% | 1m | 5k | 1,269 | 153,386 |
| UK120 | 2.25 | +2%/+3% | 7/1.05% | 50/70/85% | 3m | 25k | 3,568 | 155,902 |
| UK110 | 2.5 | +2%/+3% | 7/1.05% | 50/70/85% | 6m | 45k | 99,394 | 157,659 |
| UK130 | 2.75 | +2%/+3% | 7/1.05% | 50/70/85% | 7m | 55k | 411,468 | 159,211 |
| UK000 | 3 | +2%/+3% | 7/1.05% | 50/70/85% | 8m | 65k | 383,056 | 160,599 |
I have also plotted the values in this table for Peak Serious cases, and the outcomes for both Active Cases and Deaths in December 2023, against k11 values between k11=2 and k11=3, in the following chart.

The surprising feature here (and in the table above it) is the slight reduction in outturn active cases for k11=3, which may well be because even Omicron, by then (December 3rd 2023), is finding it harder to find susceptible people, which has often been the case when modelling previous variants. At the highest transmission rate, susceptible people are found sooner, possibly leaving less to find later.
We see from the relevant charts that the peaks in active and serious cases for k11=3, after which there is decline, are sooner, in April/May 2022, than for k11=2.75, where peaks are only just before December 2023.
Comparative charts for k11=2.75 and k11=3
Here is Chart 303 for Scenario UK_130, with k11=2.75, in a visual comparison with the UK_000 scenario with k11=3 shown earlier, highlighting in UK_130 the expected slightly less steep growth of v4, and the later peaks in active and serious cases, and slightly different behaviour of v4 (Omicron) from days 1,000-1,400 after its initial decline.
There is a small bump in cases also occurring later, in October 2023 for k11=2.75, rather than February 2023 for k11=3, which leads to the higher 3rd Dec 2023 (Day 1400) outturn for k11=2.75 prior to the final decline of v4. Slide the slider to see the differences.


For the chemistry graduates amongst readers: I’m told by a regular correspondent that this late behaviour of my model could be evidence of the manifestation of Grote-Hynes theory (a well-known model for chemical reactions) as perhaps described in this 2017 book by Baron Peters, Reaction Rate Theory and Rare Events Simulations (pp.451-471).
The author states “Kramers’ theory of barrier crossing under the influence of friction is based on a simple Langevin equation with Markovian friction and random forces coupled to reaction coordinate motion Kramers (1940) [1]. The random forces and friction represent the ‘bath’, i.e. every degree of freedom except for the explicitly modeled ‘reaction coordinate.’ In the Kramers model, the response by the bath to a change in the reaction coordinate is both immediate and immediately forgetful. Real solvents require time to reshape the solute cavity, to rearrange the hydrogen bond network, and to reorient polar solvent molecules. These solvent relaxation processes can take many picoseconds to complete. By comparison, chemical bonds can be broken and made in just fractions of a picosecond because typical reactions only require a few atoms to move by a few Angstroms. Clearly, Markovian friction models cannot accurately describe solvent dynamics during a chemical reaction.”
It was suggested to me that the progress of the virus in the epidemic might be analogous to the mixing of chemicals in chemical reactions, with damping of the rate of reaction, through “friction” as it progresses, an analogy for the reduction in the rate of viral spread through the air, as susceptible people become harder to find. I’ll leave that there!!
Concluding comments
This update post summarises my Omicron modelling so far. As more information about Omicron comes along, I will revise the material in a further post, but I shall wait until something more definitive appears.
The research papers I have referenced and summarised add a lot to the perspective, but they indicate clearly that much more data is needed, as do the UK Government Omicron reports.
As always, I am indebted to Prof Alex de Visscher for his original model and for his work with Dr Tom Sutton and me to add some of the functionality reported here. Errors and omissions are all mine!

One thought on “Omicron modelling update – Coronavirus”