Summary
As I was completing my most recent post in late November, the Omicron mutation of the SARS-Cov-2 virus was detected and sequenced in several countries.
Omicron is thought to have higher infectiousness than the Delta variant, but with possibly milder symptoms. There would be great concerns should it turn out to cause more severe symptoms, higher mortality, and possibly worst of all in the longer term, if it were able to evade current Covid-19 vaccines to a significant extent.
There is very little solid data on Omicron at present, but I have run some comparative model simulations with different settings for my model proxy for it, variant v4.
First, though, I set a modelling context for the possible impact of Omicron by reference to the recent paper from the London School of Hygiene and Tropical Medicine (LSHTM) that I mentioned last time, which set upper limits on the cases and deaths burden for Covid-19 in the Delta context.
Remaining hospitalisation and deaths burden in UK/Europe – LSHTM
A recent study by the Mathematical Modelling of Infectious Diseases team at the London School of Hygiene & Tropical Medicine (LSHTM) has addressed the questions “what is the likely maximum burden of deaths and hospitalisations from the pandemic in the UK? How does this compare to other countries in Europe?”
The study takes into account the levels of vaccination here and in other countries, by population age breakdown, and by the proportion of each population segment that has been infected in the past. Different vaccine efficacies and immunity waning are not included, and no allowance is made for the appearance of a new variant, either significant growth of AY.4.2, the previous variant that had been worrying UK Government, or Omicron.
In a sense the study is looking at how much “headroom” the current SARS-Cov-2 infection might have left in any individual country, by assuming that everyone in the population were exposed to COVID immediately, and looking at the outcomes; it’s not a prediction of what is going to happen, but just as with my own projections, it calibrates what could happen under certain parametric assumptions.
For the UK it chooses England as the source of data; picking just one of the four UK home countries assures a consistent view of the data, as they all have slightly different ways of gathering data. England offers the biggest data sample, as it is the largest of the four home UK countries.
The study found that in England the maximum burden, under such assumptions, would be 10,479 more deaths. Given the broad similarities in vaccination, NPIs (Non-Pharmaceutical Interventions), demography, culture and behaviours in the home countries, this number could be proportioned for each of the home countries in the UK, and scaled up for the UK as a whole; the equivalent UK figure might be approximately 12,500.
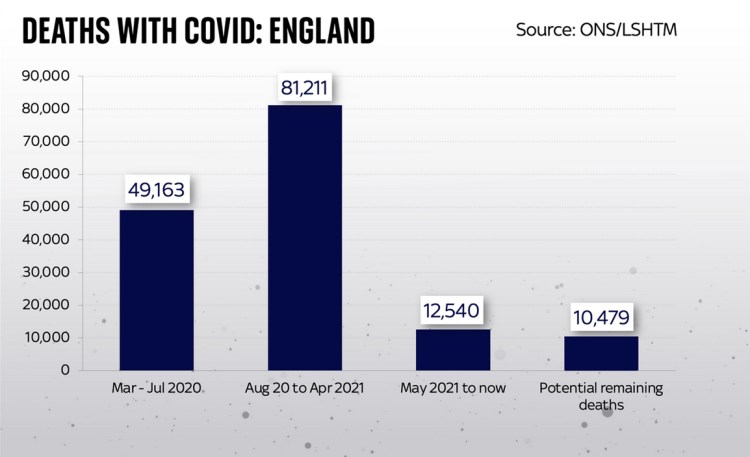
Here is a Sky News chart for England, drawn from the LSHTM study outcomes and Office for National Statistics (ONS) data, showing the potential vs. the history, which makes clear that the model projection from this point forward is for fewer deaths than we have had since May 2021 until now.
The study goes on to compare England with other European countries. It shows generally the same countries as I have reported before as having the worst outcomes in deaths per 100,000 of population, and a relatively more encouraging outlook for England (and, by extension, for the UK).
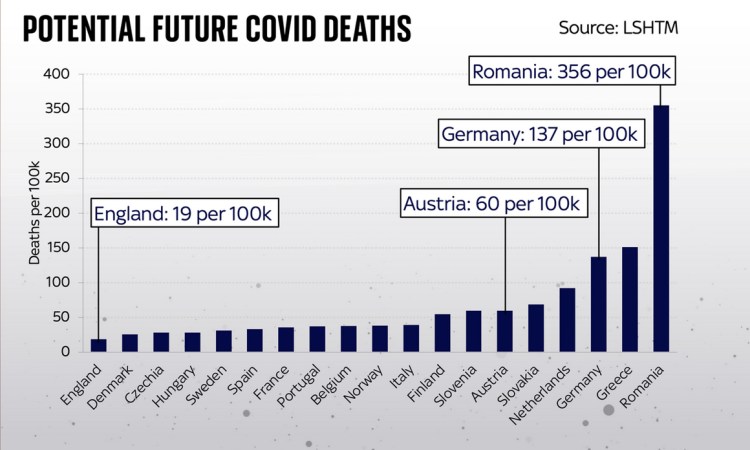
These are indeed stark differences, but if you live in England (or the UK), it’s more reassuring, with the worst case model outlook being 19 more deaths per 100,000 population.
Look how much higher many other European countries are: Germany faces potential deaths of 137 per 100,000; the Netherlands 92 per 100k and Austria 60 per 100k. In some countries further afield the risk is higher still: in Greece the potential deaths are 151 per 100,000 and in Romania it is 356 per 100,000, which isn’t surprising given the charts I have shown before for reported data.
Finally, I add one of the study’s own charts, showing the potential hospitalisations for each country, on a log y-scale with 95% confidence-intervals.

The study’s lead author, Lloyd Chapman, was reported widely as saying that the relatively good prognosis for the UK was not cause for unalloyed congratulations. “In a sense we paid a very high price for being further along a path towards having a high level of immunity in the population,” he said. “Whether that was the right strategy or not, I think in a way only time will tell.”
Commenting on the early delivery of vaccination and booster vaccinations, he also said: “England has done a good job of getting higher vaccination coverage in the eldest age groups.”
Discussion
My reason for starting with the LSHTM study is that it highlights the importance of the current vaccine programme in the UK. It puts the UK in a leading position in moving from epidemic to endemic status for Covid-19; past infections are taken into account, but on their own they would not have allowed us to get to “herd immunity” at all, and certainly not in an ethical way that minimises deaths. Vaccination has been the key.
Even the July 19th “Freedom Day” is questionable ethically, since we have had 15,000 deaths in the UK since then, and as the study’s lead author, Lloyd Chapman put it “In a sense we paid a very high price…Whether that was the right strategy or not, I think in a way only time will tell.”
Omicron
The first and most important question about Omicron, in my mind, is whether it can evade vaccines to a significant degree.
If Omicron cannot evade vaccines, then, it would seem, no matter how transmissive or virulent it is, it is bound by the outcome for deaths in that LSHTM study – it might force the additional deaths outcome nearer to 19 additional deaths per 100,000 of population in England (or the UK) than prior to Omicron, and sooner, perhaps, but hopefully not exceed that. The LSHTM study assumed immediate infection by Covid-19, and so transmission rate isn’t a factor in that “worst-case” scenario.
This recent paper by Alex Sigal et al indicates the propensity for Omicron to escape vaccines. It is also reported by CNBC, with commentary by Pfizer who say “Pfizer and BioNTech published initial lab results early Wednesday [8th December 2021] that also showed a significant reduction in the two-dose vaccine’s ability to fight omicron. However, the companies found that a booster dose offers significant protection against the variant and the two-dose series may still protect against severe disease.”
Update 15th Dec: an updated version of this paper with more participants and experiments has been submitted to medRxiv, and is available for download at the Sigal Lab website while it undergoes the medRxiv checks, as stated at Alex Sigal’s Twitter feed, where this chart appears, indicating the vaccine efficacy reduction to Omicron depending on prior vaccination or previous infection (or severe infection) and vaccination:

If Omicron can evade vaccines, and dent the efficacy of the levels of vaccination the UK has achieved, then all bets are off, as I suppose one of the study’s authors, Adam Kucharski, might be tempted to put it (he is also author of a book about casino gambling “The Perfect Bet“).
After the critical issue of whether Omicron can evade vaccines, there is the question of its mortality. In the LSHTM study, everyone susceptible – not previously infected or vaccinated – becomes infected immediately, with outcomes depending on Delta mortality rates, because LSHTM had modelled in the prevailing Delta variant environment. We might need to re-visit that in the Omicron context.
In my Coronavirus model, therefore, I explore the impact of lower efficacy to Omicron of the vaccine phases (separately for first, second and booster jabs), as well as some virulence and mortality changes compared with previous variants. I present some preliminary outcomes.
I also look at the impact of lower virulence and mortality, on the basis of some hints (only) that Omicron cases might be milder. I also look at lower mortality.
If Omicron is more virulent, then serious illness and hospitalisations would increase, which would be an issue for NHS capacity. What little we have seen so far suggests that symptoms might be milder. I will show some differences in serious illness outcomes in my model too.
Initial settings for four comparative runs of the v4 Omicron model
Some of the key parameters for a variant in my model are its transmission rate (k11 in the model), its virulence, fSS and its mortality, fmort. In the vaccination context, the relative efficacy var_eff to different variants will vary. I take account of this too, using it as a fractional multiplier on the base vaccine efficacy, which is managed in another setting, vac_eff, but I don’t change that here; vac_eff itself is less than 100%, by an amount depending on jab number (1, 2 or 3).
I don’t change k11 for these initial comparative runs because the little evidence so far seems to indicate clearly that Omicron is much more transmissive than Delta (and therefore even more so compared with the original and Alpha variants). I have made it three times (k11 = 3) as transmissive as Delta (k11 = 1) for all of these model runs.
| v4 Scenario | Transmission rate k11 | fSS/fmort | var_eff for jabs 1/2/3 |
|---|---|---|---|
| UK_05 | 3 | 7%/1.5% | 50%/70%/85% |
| UK_03 | 3 | 7%/1.5% | 25%/50%/70% |
| UK_08 | 3 | 10%/1.5% | 50%/70%/85% |
| UK_06 | 3 | 10%/1.5% | 25%/50%/70% |
Vaccination hesitation, by population group, and vaccination waning are also included in my model, but I don’t change these for this initial exploration of the impact of a putative Omicron variant.
I have increased the model projection period from 800 to 1,000 days, as I have seen in earlier runs the tendency of the active cases and serious cases caused by Variant 4, my proxy for Omicron, not only to rise and fall, as usual, but also to increase again in the medium term. I believe this to be caused by immunity waning in the model, which varies between a half-life of 3 months up to 5 months in the model, depending on vaccination status (none, 1, 2 or 3).
Comparative charts for variant 4
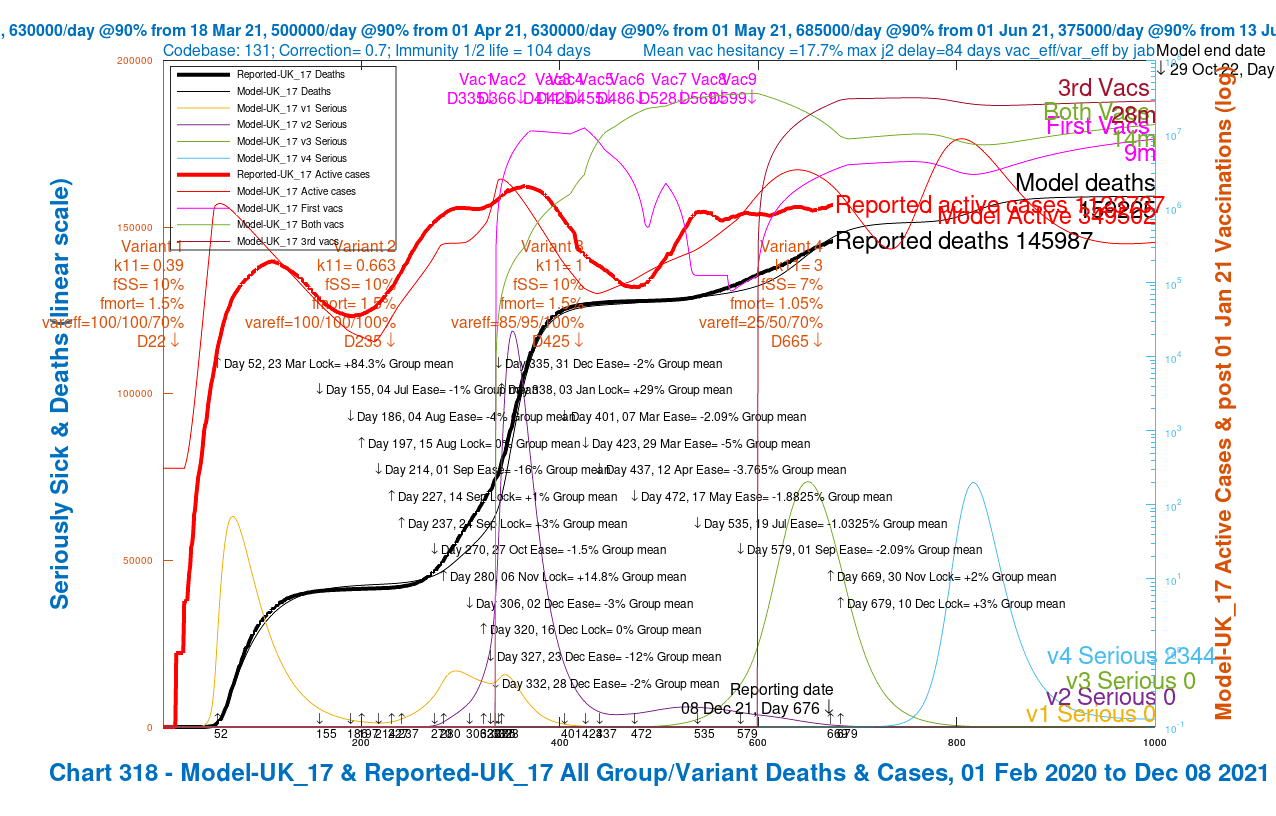
My Chart 318 plots reported active cases and deaths, up to December 7th, compared with modelled active cases and deaths, which are projected forward to 29th October 2022.
Modelled serious cases caused by each of the four variants – the original (v1), Alpha (v2), Delta (v3) and v4, my putative Omicron variant, are also plotted on this chart, which makes it a busy one.
I have shown the chart 318 for each of the four scenarios in a slideshow that show the relative outcomes for the four model runs visually.
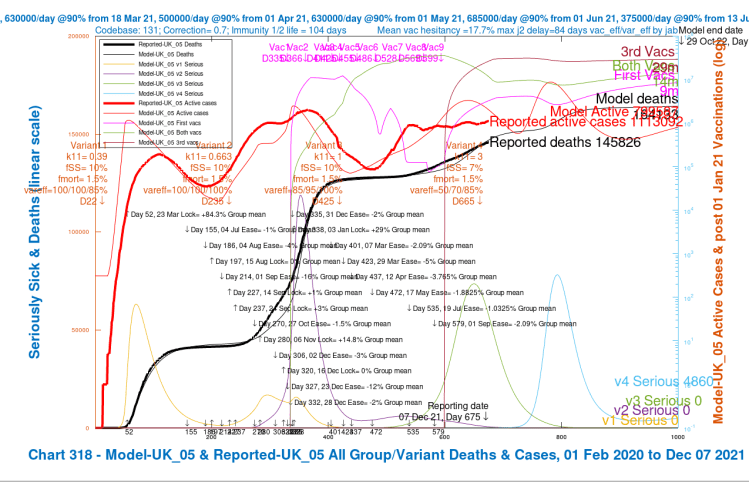
Chart 318 for scenario UK_05 with vaccinations. 17th May 1.8% ,19th July 1% and 1st Sep 2% mean NPI relaxations. v4 transmission k11 = 3, var_eff = 50/70/85%, v4 fss 7% and fmort 1.5%. v3 fss=10% and fmort =1.5%. Model outcomes to October 29th 2022. Reported active cases and deaths to December 7th. Serious cases for 4 variants. 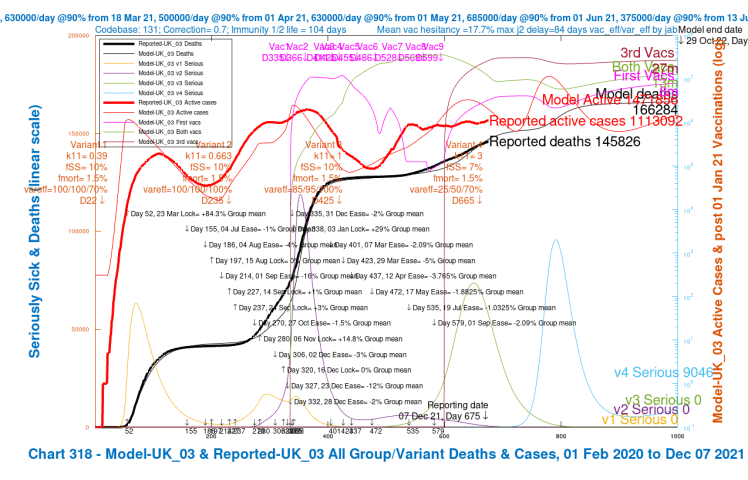
Chart 318 for scenario UK_03 with vaccinations. 17th May 1.8% ,19th July 1% and 1st Sep 2% mean NPI relaxations. v4 transmission k11 = 3, var_eff = 25/50/70/%, v4 fss 7% and fmort 1.5%. v3 fss=10% and fmort =1.5%. Model outcomes to October 29th 2022. Reported active cases and deaths to December 7th. Serious cases for 4 variants. 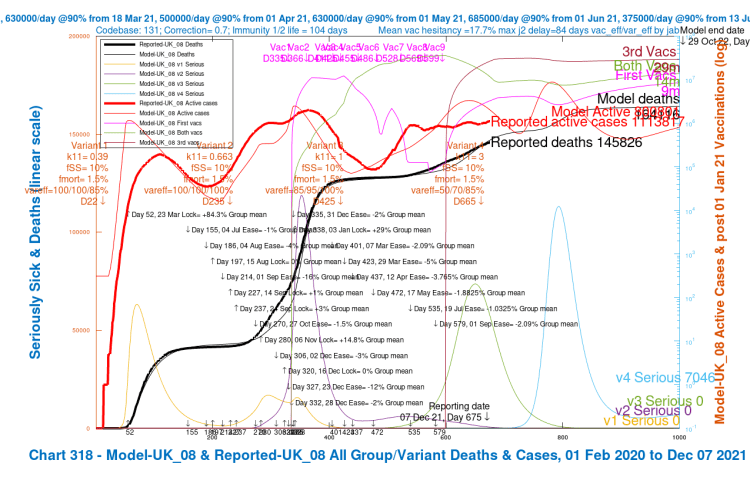
Chart 318 for scenario UK_08 with vaccinations. 17th May 1.8% ,19th July 1% and 1st Sep 2% mean NPI relaxations. v4 transmission k11 = 3, var_eff = 50/70/85%, fss 10% and fmort 1.5%. Model outcomes to October 29th 2022. Reported active cases and deaths to December 7th. Serious cases for 4 variants. 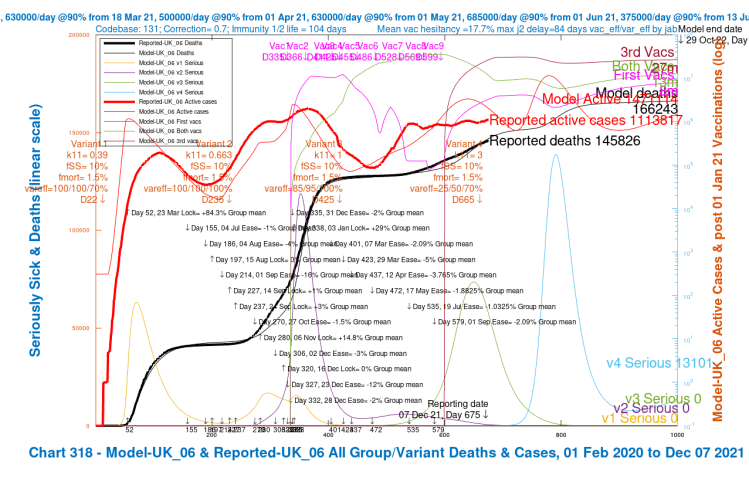
Chart 318 for scenario UK_06 with vaccinations. 17th May 1.8% ,19th July 1% and 1st Sep 2% mean NPI relaxations. v4 transmission k11 = 3, var_eff = 25/50/70%, fss 10% and fmort 1.5%. Model outcomes to October 29th 2022. Reported active cases and deaths to December 7th. Serious cases for 4 variants.
We see variation in the outcomes for the modelled active cases, serious cases and deaths depending on the limited range of parameter choices I have made for fSS, the virulence, and var_eff, the relative vaccination efficacy to v4, my proxy for Omicron, compared with earlier variants.
For this first set of four scenarios, I haven’t changed v4 mortality, fmort. I don’t yet have reliable indications, although most reports so far are that there have been few if any deaths so far.
But a) there hasn’t been much time since Omicron cases were first sequenced, b) many of the cases are of people who have been vaccinated, c) infected younger people, even though unvaccinated, show less serious outcomes, being more resilient than older people, for whom vaccination may well be doing its job, at least in part, and d) the demography (particularly age-profile) and vaccination history in South Africa (where some early commentary has been made) are different from the UK. This all makes it a complex picture against which to interpret the apparently lower virulence and mortality of Omicron.
I have added the modelled cumulative deaths outcomes for October 29th 2022 to the table we saw before.
| v4 Scenario | Transmission rate k11 | fSS/fmort | var_eff for jabs 1/2/3 | Peak serious v4 cases | Deaths at 29th Oct ’22 |
|---|---|---|---|---|---|
| UK_05 | 3 | 7%/1.5% | 50%/70%/85% | 75,000 | 164,133 |
| UK_03 | 3 | 7%/1.5% | 25%/50%/70% | 90,000 | 166,284 |
| UK_08 | 3 | 10%/1.5% | 50%/70%/85% | 120,000 | 164,116 |
| UK_06 | 3 | 10%/1.5% | 25%/50%/70% | 140,000 | 166,243 |
We can see quite clearly that outcomes are much more correlated with relative vaccination efficacy var_eff, at either 25/50/70% or 50/70/85% for each jab status 1, 2 or 3 respectively, than with the setting for fSS (the proportion of the sick becoming seriously sick) at either 7% or 10%, which I use as a measure of virulence.
Of course, this is quite speculative at this stage, but it shows the capability of the model to help understand the impact of Omicron, once we have more data about it. One point to note is that in all scenarios, variant v4, Omicron, at its high infection transmission rate, overtakes v3, Delta, in terms of serous cases, becoming the dominant variant within six weeks from November 27th, its arrival date in the model.
Parametric runs with lower mortality fmort
This further set of scenarios has v4 mortality fmort also reduced by 30%, in addition to the reduction in fSS by 30% in the previous charts. Here is the slideshow for this case,
Chart 318 for scenario UK_06 with vaccinations. 17th May 1.8% ,19th July 1% and 1st Sep 2% mean NPI relaxations. v4 transmission k11 = 3, var_eff = 25/50/70%, fss 10% and fmort 1.5%. Model outcomes to October 29th 2022. Reported active cases and deaths to December 7th. Serious cases for 4 variants. 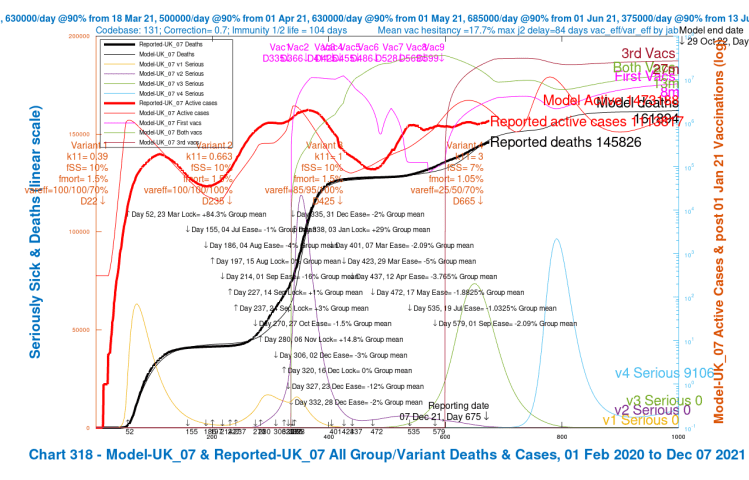
Chart 318 for scenario UK_07 with vaccinations. 17th May 1.8% ,19th July 1% and 1st Sep 2% mean NPI relaxations. v4 transmission k11 = 3, var_eff = 25/50/70/%, v4 fss 7% and fmort 1.05%. v3 fss=10% and fmort =1.5%. Model outcomes to October 29th 2022. Reported active cases and deaths to December 7th. Serious cases for 4 variants. Chart 318 for scenario UK_08 with vaccinations. 17th May 1.8% ,19th July 1% and 1st Sep 2% mean NPI relaxations. v4 transmission k11 = 3, var_eff = 50/70/85%, fss 10% and fmort 1.5%. Model outcomes to October 29th 2022. Reported active cases and deaths to December 7th. Serious cases for 4 variants. 
Chart 318 for scenario UK_09 with vaccinations. 17th May 1.8% ,19th July 1% and 1st Sep 2% mean NPI relaxations. v4 transmission k11 = 3, var_eff = 50/70/85%, v4 fss 7% and fmort 1.05%. v3 fss=10% and fmort =1.5%. Model outcomes to October 29th 2022. Reported active cases and deaths to December 7th. Serious cases for 4 variants.
and the corresponding outcomes for these cases are summarised in this table.
| v4 Scenario | Transmission rate k11 | fSS/fmort | var_eff for jabs 1/2/3 | Peak serious v4 cases | Deaths at 29th Oct ’22 |
|---|---|---|---|---|---|
| UK_09 | 3 | 7%/1.05% | 50%/70%/85% | 75,000 | 160,486 |
| UK_07 | 3 | 7%/1.05% | 25%/50%/70% | 95,000 | 161,894 |
| UK_08 | 3 | 10%/1.5% | 50%/70%/85% | 120,000 | 164,116 |
| UK_06 | 3 | 10%/1.5% | 25%/50%/70% | 140,000 | 166,243 |
Comparative scenarios UK_06 and UK_08 are the same as before, there being no reduction in fSS and fmort, but the new cases UK_07 and UK_09, with their lower fmort settings as well as for fSS, show reductions in deaths, compared with UK_03 and UK_05, of 4,390 and 3.657 respectively, % reductions of about 2.6% and 2.2%.
Once we know more about the transmission rate, virulence and mortality of Omicron, I can run more appropriate scenarios, just as I have run these exploratory ones.
The effect of immunity waning
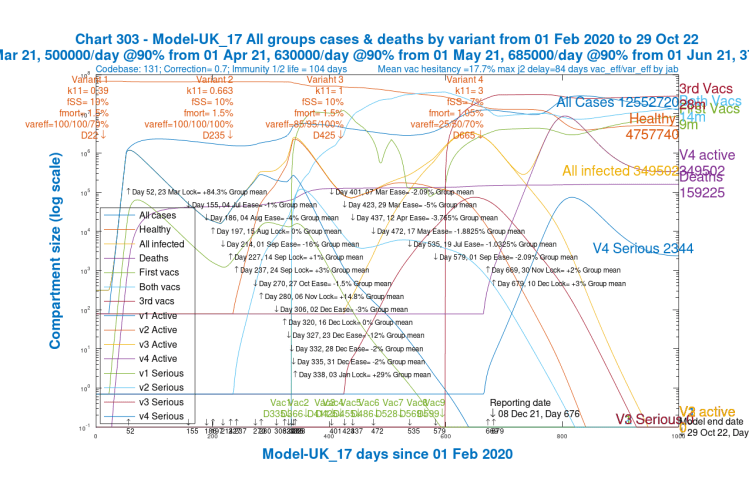
We can see from the following chart 303 for the pandemic in the UK, showing each variant’s cases and serious cases individually, that by early New Year 2022, variant v4 (Omicron) has displaced Delta as the dominant variant, owing to its far higher R0.
This kind of displacement of one variant by another of higher R0 is described by Prof Maia Martcheva in her book An Introduction to Mathematical Epidemiology. In Chapter 8, on Multistrain Disease Dynamics, she describes it at (p183 pp) the “Competitive Exclusion Principle“.
This likely Omicron outcome has been recognised by the UK Government too, who state in their latest update on that page that “it is likely to outcompete Delta in the UK and become the dominant variant.” I have covered this many times before in my blog posts, when modifying my model for Alpha and Delta, in late 2020 and early 2021 respectively.
To highlight immunity waning, I show just Chart 303 for Scenario UK_07, which is typical of the other scenarios with respect to immunity waning. At the right of the chart, it shows (as do the others to a greater or lesser extent) the re-growth of the variant v4, starting in around July 2022, in both active and serious cases (the purple and light blue curves respectively), which is different from previous variants’ behaviours.
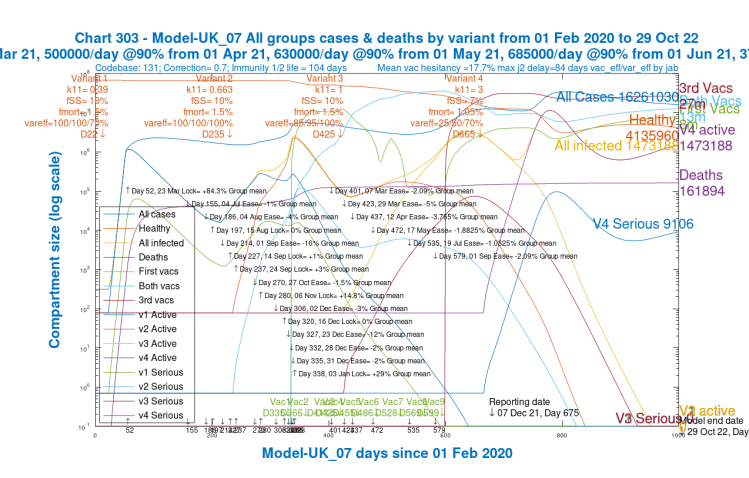
Given its arrival now that the UK vaccination programme is mature, this quite different behaviour of v4 from that of v3 (Delta), which was more controlled in the earlier days of UK vaccination, is very noticeable. Variants v1 and v2 arrived in 2020’s somewhat nascent and variable NPI environment, respectively, which shows clearly in the chart, and so their history is not so comparable.
Note also that in terms of active cases, v4 becomes dominant, overtaking v3, even sooner than for serious cases above, in less than five weeks from November 27th. This is just because serious cases take longer to develop.
Adding new Non-Pharmaceutical Interventions (NPIs)
The next parametric runs of my model includes an estimate of the effect of the UK Government NPIs added on November 30th (+2%), and more announced on December 10th (+3%), to assess the effect on outcomes. These changes include aspects of the Government’s plan B for pandemic mitigation, and more. I show them in the charts below, and in the table that follows.
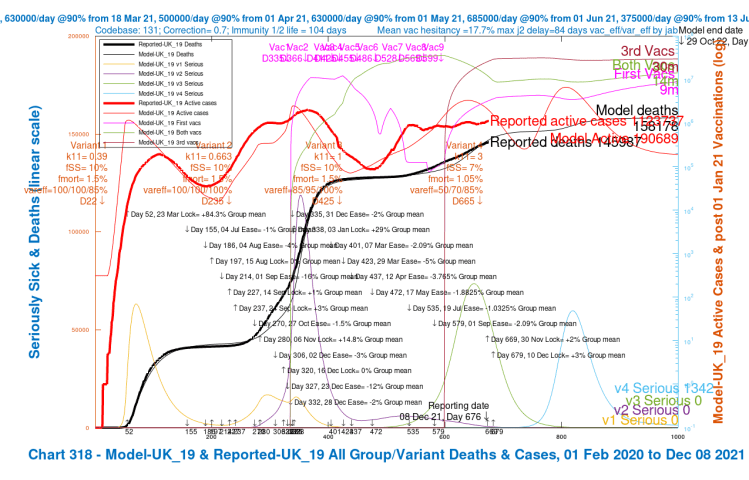
Chart 318 for scenario UK_19 with vaccinations. 17th May 1.8% ,19th July 1%, 1st Sep 2%, mean NPI relaxations and 30th Nov +2% and 10th Dec +3% additional NPIs. v4 transmission k11 = 3, var_eff = 50/70/85%, fSS 7% and fmort 1.05%. Model outcomes to October 29th 2022. Reported active cases and deaths to December 8th. Serious cases for 4 variants. 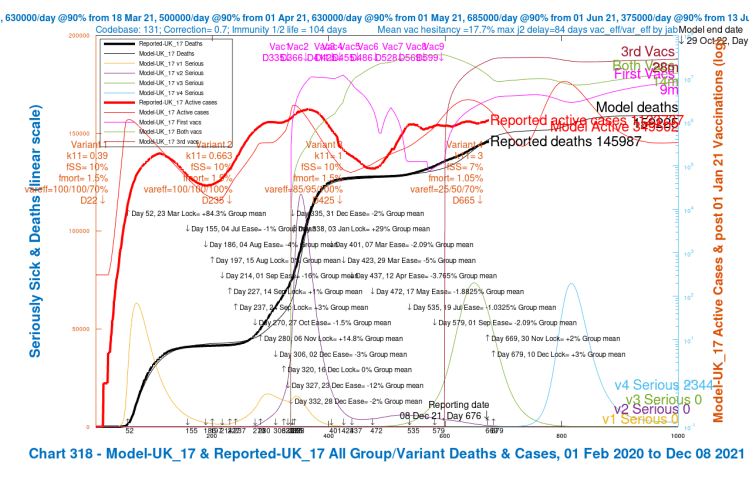
Chart 318 for scenario UK_17 with vaccinations. 17th May 1.8% ,19th July 1%, 1st Sep 2%, mean NPI relaxations and 30th Nov +2% and 10th Dec +3% additional NPIs. v4 transmission k11 = 3, var_eff = 25/50/70%, fSS 7% and fmort 1.05%. Model outcomes to October 29th 2022. Reported active cases and deaths to December 8th. Serious cases for 4 variants. 
Chart 318 for scenario UK_18 with vaccinations. 17th May 1.8% ,19th July 1%, 1st Sep 2%, mean NPI relaxations and 30th Nov +2% and 10th Dec +3% additional NPIs. v4 transmission k11 = 3, var_eff = 50/70/85%, fSS 10% and fmort 1.5%. Model outcomes to October 29th 2022. Reported active cases and deaths to December 8th. Serious cases for 4 variants. 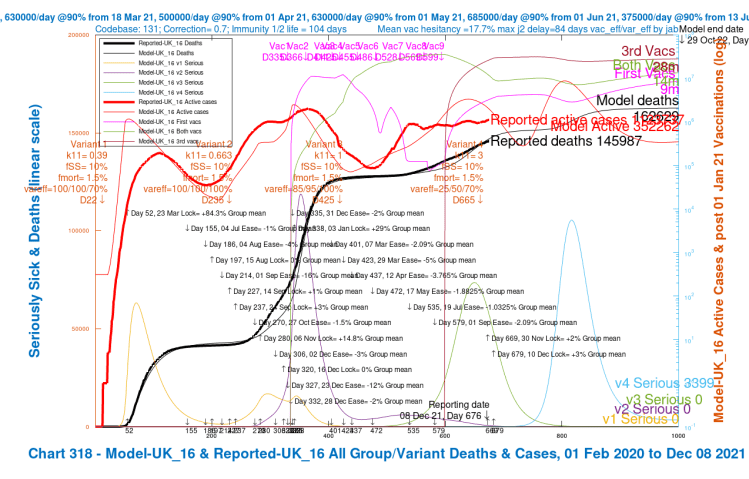
Chart 318 for scenario UK_16 with vaccinations. 17th May 1.8% ,19th July 1%, 1st Sep 2%, mean NPI relaxations and 30th Nov +2% and 10th Dec +3% additional NPIs. v4 transmission k11 = 3, var_eff = 25/50/70%, fSS 10% and fmort 1.5%. Model outcomes to October 29th 2022. Reported active cases and deaths to December 8th. Serious cases for 4 variants.
We see In these four scenarios fewer active and serious cases than before, and fewer deaths, summarised in the table below.
| v4 Scenario | Transmission rate k11 | fSS/fmort | var_eff for jabs 1/2/3 | Peak serious v4 cases | Deaths at 29th Oct ’22 |
|---|---|---|---|---|---|
| UK_19 | 3 | 7%/1.05% | 50%/70%/85% | 60,000 | 158,178 |
| UK_17 | 3 | 7%/1.05% | 25%/50%/70% | 70,000 | 159,225 |
| UK_18 | 3 | 10%/1.5% | 50%/70%/85% | 80,000 | 161,104 |
| UK_16 | 3 | 10%/1.5% | 25%/50%/70% | 100,000 | 162,629 |
Depending somewhat on scenarios, modelling of the NPIs just enacted and announced has the effect of reducing peak serious cases in the spring of 2022 by between 20% and 30%, and deaths by between 1.5% and 2.5%.
We also see that the bounce in v4 active and serious cases (at the right of the charts) in the summer of 2022 is flattened a little, but the cases still do not diminish in the way that we have seen for earlier variants; immunity waning, in the absence of further 2022 vaccination booster phases, still has a big effect. I show this again in Chart 303 for for scenario UK_17, which shows the very different behaviour of v4 (Omicron) from v3, Delta, as do the other three NPI scenarios to a greater or lesser degree.
Charts for 30% increased fSS and fmort
To complete the symmetry of the scenarios, I quickly present the charts for 30% increased fSS = 13% and fmort = 1.95% for variant v4, which, as expected, show higher outcomes for active cases, serious cases and deaths, to different degrees.
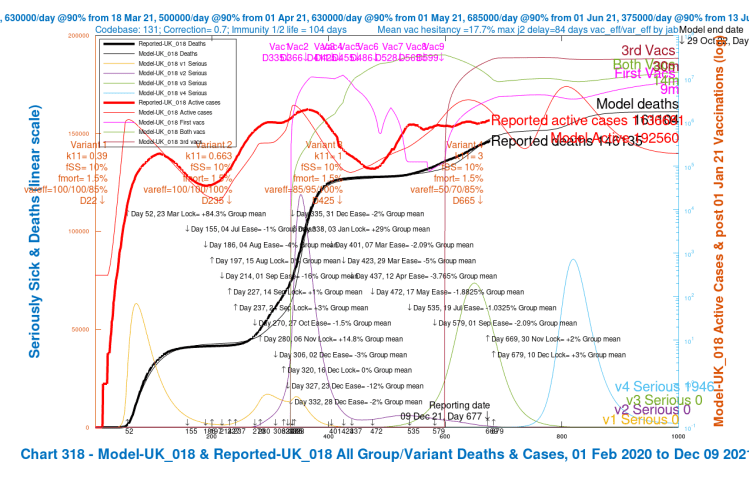
Chart 318 for scenario UK_018 with vaccinations. 17th May 1.8% ,19th July 1%, 1st Sep 2%, mean NPI relaxations and 30th Nov +2% and 10th Dec +3% additional NPIs. v4 transmission k11 = 3, var_eff = 50/70/85%, fSS 10% and fmort 1.5%. Model outcomes to October 29th 2022. Reported active cases and deaths to December 9th. Serious cases for 4 variants. 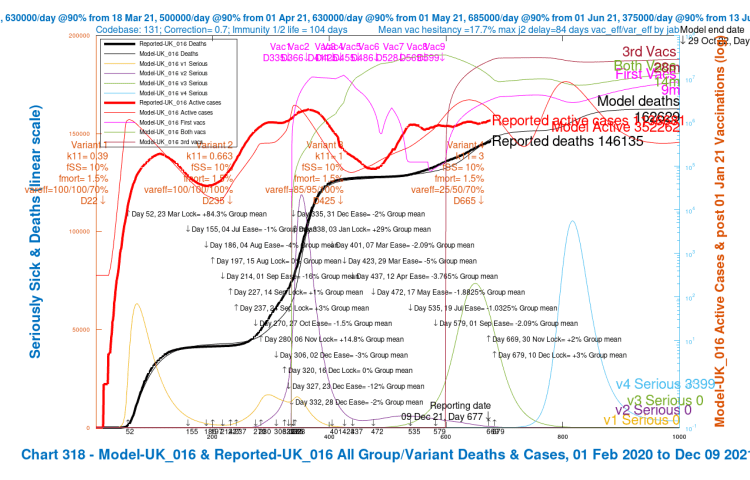
Chart 318 for scenario UK_016 with vaccinations. 17th May 1.8% ,19th July 1%, 1st Sep 2%, mean NPI relaxations and 30th Nov +2% and 10th Dec +3% additional NPIs. v4 transmission k11 = 3, var_eff = 25/50/70%, fSS 10% and fmort 1.5%. Model outcomes to October 29th 2022. Reported active cases and deaths to December 9th. Serious cases for 4 variants. 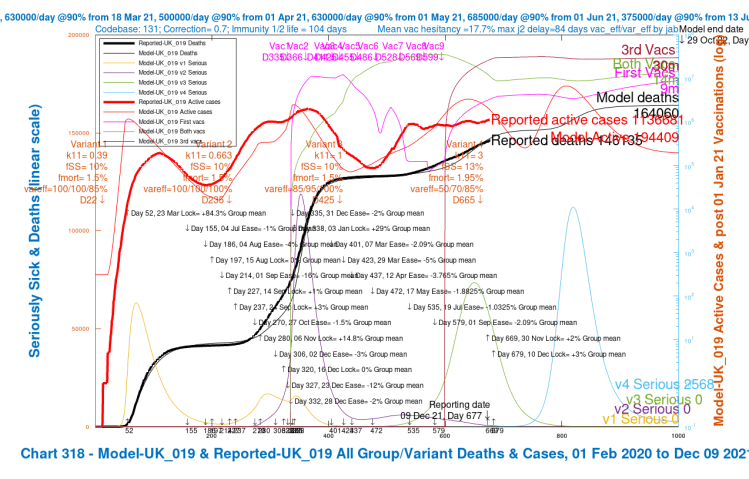
Chart 318 for scenario UK_019 with vaccinations. 17th May 1.8% ,19th July 1%, 1st Sep 2%, mean NPI relaxations and 30th Nov +2% and 10th Dec +3% additional NPIs. v4 transmission k11 = 3, var_eff = 50/70/85%, fSS 13% and fmort 1.95%. Model outcomes to October 29th 2022. Reported active cases and deaths to December 9th. Serious cases for 4 variants. 
Chart 318 for scenario UK_017 with vaccinations. 17th May 1.8% ,19th July 1%, 1st Sep 2%, mean NPI relaxations and 30th Nov +2% and 10th Dec +3% additional NPIs. v4 transmission k11 = 3, var_eff = 25/50/70%, fSS 13% and fmort 1.95%. Model outcomes to October 29th 2022. Reported active cases and deaths to December 9th. Serious cases for 4 variants.
Chart 303 for UK_019, also with NPIs in December, shows similar immunity waning features to the scenario UK_17, with the flattening of the decline of variant v4 active and serious cases. This group of scenarios, with 30% higher virulence and mortality all show this feature to a greater or lesser extent.

Summary table
Fo ease of reference, I have tabulated all the outcomes, including scenarios UK_017 and UK_019 for 30% higher fSS and fmort, into the table below. Comparative scenarios UK_016 and UK_018 reproduce scenarios UK_16 and UK_18 respectively (there boing no fSS and fmort changes in those comparative scenarios) and aren’t required. All results are for k11 = 3, as before.
| v4 Scenario | Nov 30th/ Dec 10th 2021 NPIs | fSS/fmort | var_eff for jabs 1/2/3 | Peak serious v4 cases | Active cases on 29th Oct ’22 | Cumulative Deaths by 29th Oct ’22 |
|---|---|---|---|---|---|---|
| UK_05 | 0 | 7%/1.05% | 50%/70%/85% | 75,000 | 799,587 | 164,133 |
| UK_03 | 0 | 7%/1.05% | 25%/50%/70% | 90,000 | 1,471,856 | 166,284 |
| UK_08 | 0 | 10%/1.5% | 50%/70%/85% | 120,000 | 800,801 | 164,166 |
| UK_06 | 0 | 10%/1.5% | 25%/50%/70% | 140,000 | 1,471,114 | 166,243 |
| UK_09 | 0 | 7%/1.05% | 50%/70%/85% | 75,000 | 800,615 | 160,435 |
| UK_07 | 0 | 7%/1.05% | 25%/50%/70% | 95,000 | 1,473,188 | 161,894 |
| UK_19 | +2%/+3% | 7%/1.05% | 50%/70%/85% | 60,000 | 194,409 | 158,178 |
| UK_17 | +2%/+3% | 7%/1.05% | 25%/50%/70% | 70,000 | 349,502 | 159,225 |
| UK_18 | +2%/+3% | 10%/1.5% | 50%/70%/85% | 80,000 | 192,560 | 161,104 |
| UK_16 | +2%/+3% | 10%/1.5% | 25%/50%/70% | 100,000 | 352,262 | 162,629 |
| UK_019 | +2%/+3% | 13%/1.85% | 50%/70%/85% | 120,000 | 194,409 | 164,060 |
| UK_017 | +2%/+3% | 13%/1.85% | 25%/50%/70% | 140,000 | 354,985 | 166,079 |
We can see from the last 6 scenarios that the additional NPIs reduce the longer term active cases by about 75%, but that the shorter term peak in serious cases (around Spring 2022) is correlated more with the fSS/fmort virulence and mortality settings.
Within those figures, a postulated higher vaccine efficacy for 1, 2 and 3 jabs for Omicron, at 50%/70%/85% of the efficacy to variants v1 and v2 (Alpha) and v3 (Delta), reduces the long term active cases by about 45%.
Across all scenarios, the lower variant v4 efficacy settings at 25%/50%/70% not only cause 80% more active cases compared with 50%/70%/85% variant v4 efficacy ratio, but they also lead to higher peaks in serious cases, by ratios of between 15% and 25% more, depending on scenario.
The greatest difference in cumulative deaths by October 29th 2022 is between scenarios UK_03 and UK_19, about a 5% difference. As far as deaths are concerned, it does seem that there might be a ceiling on deaths, if not active cases, at least as far as these initial model runs indicate, just as the LSHTM work indicated for the Delta environment.
The UK’s remaining burden of deaths post-Omicron
Taking my variant v4 as the proxy for Omicron at this very early stage, the maximum modelled cumulative Covid-19 UK deaths in my scenarios at October 29th 2022, which are for case UK_03, at 166,284, are 20,149 more than the 146,135 cumulative UK Government reported deaths on December 9th 2021, which is a increase of about 14%.
That increase for the UK, 20,149, represents about an additional 29 deaths per 100,000 of the UK’s current population of 68,404,370, as reported by Worldometer. This is more than LSHTM’s figure of 19 per 100,000 for the England , which is probably representative of the UK, but I have added the Omicron variant to the analysis, which wasn’t within LSHTM’s assumptions.
My Omicron figures, which do reflect immunity waning and re-growth in Omicron infections, don’t allow for new booster vaccinations in 2022, which highlights the effect of immunity waning, and the need for more boosters in 2022.
Discussion
It is unlikely in practice that re-growth in cases in Summer 2022 would be allowed to happen to such an extent. Just as we have had an Autumn 2021 booster programme of vaccination in the UK, adding the (even more than realised) crucial third vaccination to the first two, we are likely to see further, annual or bi-annual vaccine boosters in 2022 and beyond as the pandemic becomes endemic in the UK. This would reduce the scale of cases, serious cases and deaths the model has indicated in 2022.
Note also the steep initial growth of variant v4 compared with Delta, the other significant variant that has arrived in the UK during the vaccination programme, on April 1st 2021. The original and Alpha variants had also grown quickly, but they had arrived into a very different situation in the UK, with no vaccination; and although NPIs (Non-Pharmaceutical Interventions) had been deployed in 2020 to try to mitigate the epidemic, they weren’t immediately and consistently applied.
What would be concerning is if the new Omicron variant v4 (or any other) could evade our vaccines. We have seen the impact of differential efficacy in these scenarios (particularly for the25%/50%/70% scenarios), and also immunity waning, as discussed, but the next few weeks of research will probably lead to better answers for Omicron.
Concluding remarks
We need more Omicron data (most importantly on vaccine evasion and mortality) before it is worthwhile making further assumptions about it. My purpose has been to exercise my model’s new functionality for a 4th variant to inform further work, exploring the model’s response to changes in several key parameters such as any new variant’s virulence, mortality, and vaccines’ relative efficacy against it.
I am indebted to Prof Alex de Visscher for his original model and for his work with Dr Tom Sutton and me to add some of the functionality reported here. Errors and omissions are all mine!

One thought on “Just as we thought it was safe to go back into the water – Coronavirus”