
Introduction
A little while ago (14th May 2020), I published a post entitled What if UK lockdown had been 2 weeks earlier?, when I explored the possible impact of a postulated lockdown intervention date of 9th March instead of 23rd March, the actual UK lockdown date.
That article focused more on the impact on the number of deaths in those two scenarios, rather than on the number of Covid-19 cases, where the published data is not as clear, or as complete, since so few people have been tested.
That post also made the point that this wasn’t a proper forecast, because the calibration of the model for that early an intervention date, 9th March, would have been compromised, as there was so little historic data to which to fit the model at that point.
Therefore the comparisons are not valid in detail against reported data, but the comparative numbers between the two modelled lockdown dates, 9th and 23rd March 2020, show how a typical model such as mine (derived from Alex de Visscher‘s code as before), is so dependent on (early) input data, and, indeed, responds in a very non-linear way, given the exponential pattern of pandemic growth.
Cases
I present below the two case numbers charts for the 9th March and 23rd March 2020 lockdown dates respectively. I had covered the deaths data in more detail in my previous post on this topic, and will return to that below.

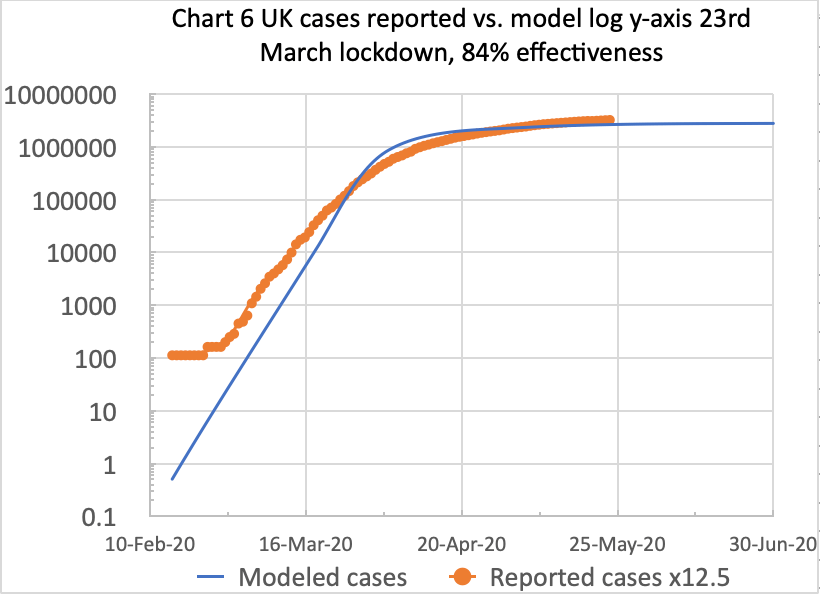
In the charts for cases above, the same reported data to date (24th May 2020) is presented in each chart (in orange), but there is a big difference in the model predictions for cases.
For the postulated 9th March lockdown, the modelled number for cases by the 23th March is 14,800, whereas the equivalent modelled number for cases for the actual 23rd March lockdown (i.e. modelled cases with no benefit from prior lockdown) is 45,049 cases, about 3 times as many as for a 9th March lockdown.
The reported cases number (the orange curves above) for 23rd March is 81,325, which is based on multiplying the UK Government’s reported numbers by 12.5, using Italy’s and other data concerning the proportion of real cases that might ever be tested, at about only 8%, as described in my Model Update post on May 8th.
Reported case numbers (in other countries too, not just in the UK) underestimate the real case numbers by such a factor, because of the lack of sufficient public Coronavirus testing.
As I said in my previous article, therefore, a reasonable multiple on the public reported numbers for comparison might be 12.5 (the inverse of 8%), which the (identical) orange curves reflect for reported cases in both charts above.
Deaths
Here are the comparative charts showing the equivalent model data for deaths, in blue, for the two lockdown dates. The reported data is the orange curve in both charts, as usual.

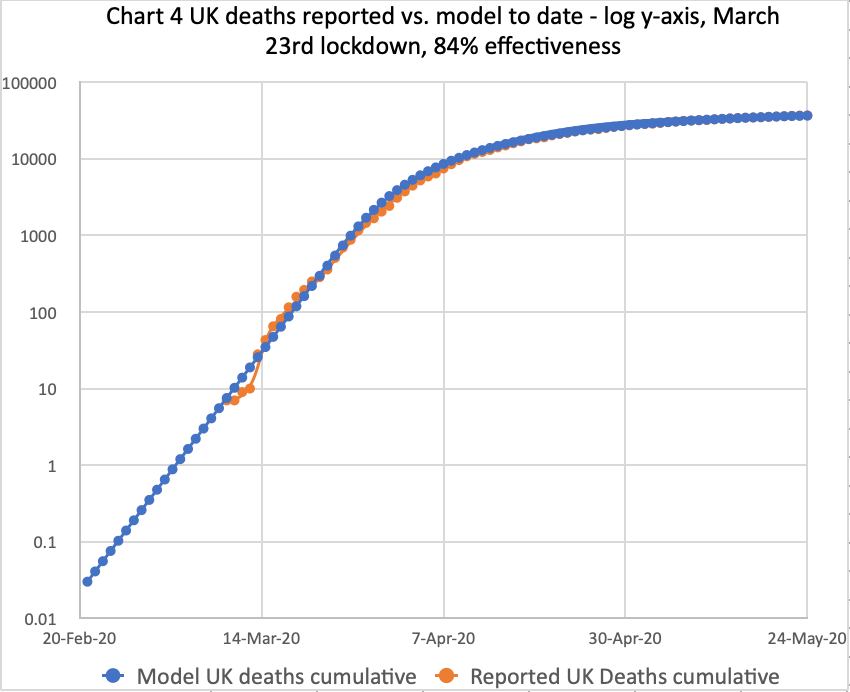
On the right, my live model matches reported deaths data quite accurately, using 84% lockdown intervention effectiveness, for the actual March 23rd lockdown. The model curve and the reported data curve are almost coincident.
On the left, for the postulated 9th March lockdown, the modelled number of deaths is reduced from that date: by 23rd March, deaths stand at 108, far fewer than 402 for the actual lockdown date of 23rd March, on the right, with no benefit from lockdown at all in this case, of course.
These compare with the model numbers for deaths at the later date of May 13th, described in my May 13th post, of 540 and 33,216 for March 9th and March 23rd lockdowns respectively, at virtually the same 84.1% intervention effectiveness.
As for the current date, 24th May, at 84% effectiveness, the numbers of modelled deaths on the right, for the actual 23rd March lockdown, is 36,660 (against the reported 36,793). For the postulated 9th March lockdown, on the left, it would have been, the model says, 570 deaths.
That seems a very large difference, but see it as an internal comparison of model outcomes on those two assumptions. Whatever the deficiencies of the availability of data to fit the model to an earlier lockdown, it is clear that, by at least an order of magnitude, the model behaviour over that 2 month period is crucially dependent on when that intervention (lockdown) happens.
This shows the startling (but characteristic) impact of the exponential pandemic growth on the outcomes from the different lockdown dates.
This applies both for an outcome reporting date, 13th May, just 51 days later than the March 23rd reporting date, and also an outcome reporting date, 24th May, 62 days after March 23rd.
The model shows deaths multiplying by 5 in the 51 day period for 9th March lockdown, but 82 times as many deaths in that period for the 23rd March lockdown. For the 62 day period (11 days more), the equivalent multiples are 5.2 and 339 for 9th March and 23rd March lockdown respectively.
My 9th March lockdown modelled numbers are lower than those from Professor Rowland Kao’s research group at Edinburgh, if their Scottish numbers are scaled up for the UK. Indeed, I think my model numbers are too low for the March 9th lockdown case. But remember, this is about model comparisons, it’s NOT an absolute forecast.
In terms of the long term outlook, under the possibly unrealistic assumption that 84% lockdown effectiveness continues, and in the possibly more realistic assumption of the absence of a vaccine, deaths plateau at 42,500 for the actual March 23rd lockdown.
But the model shows deaths would have plateaued at 625 if the lockdown had been March 9th (as covered in my previous post).
Conclusions
For cases, the modelled March 9th lockdown long-term plateau, under similar assumptions, would have been 41,662 cases; but for the actual 23rd March lockdown, the model shows 2.8 million cases, a vastly higher number.
This shows the effect of exponential pandemic behaviour, even with only a 2 week difference in the timing of the intervention measures (at 84% effectiveness in both cases). That’s how vital timing is, as is the effectiveness of measures taken, in a pandemic situation.
These long-term model outcomes reflect the observation of a likely deaths/cases ratio of 1.5%, estimated from the “captive” community on the cruise ship Diamond Princess.
But as I emphasised earlier, these are comparisons within my model, to assess the nature and impact of an earlier lockdown, with the main focus in this article being the cases data.
It is a like-for-like comparison of modelled outcomes for two assumptions, one for the actual lockdown date, 23rd March, where the model fits reported data quite well (especially for deaths), and one for the earlier, postulated 9th March lockdown date that has been discussed so often, but where the model fit must be questionable owing to the lack of data at that stage for model fitting.

2 thoughts on “My model calculations for Coronavirus cases for an earlier UK lockdown”